Action Debug
"Action Debug" is used to perform a "Controllable, Observable" online debugging for a device's Action (Downlink/Command/Write/Control Action): You select channel and device, select Action, the system dynamically generates a form based on Action input definition, and displays structured return result and elapsed time after submission.
Applicable Scenarios
- Command Integration: Verify if device write/control is reachable, parameter encoding is correct, driver executes as expected
- Regression Verification: Quickly regress with same set of Action parameters after driver upgrade/parameter change
- Field Troubleshooting: Confirm if failure is "Device Offline/Link Unreachable/Parameter Illegal/Timeout"
Risk Warning
Action is often "Side-effecting": It may cause device start/stop, write register, switch gate, reset, etc.
- Recommend using minimal impact action in production: Prioritize "Read-only/Probe" actions for connectivity verification
- Set shorter TTL log and stricter permission for critical actions: Avoid misoperation and log storm
- Clarify timeout semantics: Timeout does not mean device did not execute, it could be "Device executed but response slow/lost"
Prerequisites and Permissions
- Login required and possess corresponding resource permissions (Channel/Device Read, Action Read and Debug Execute permissions)
- Target device needs to have Action definition created, and driver supports execution path of this Action
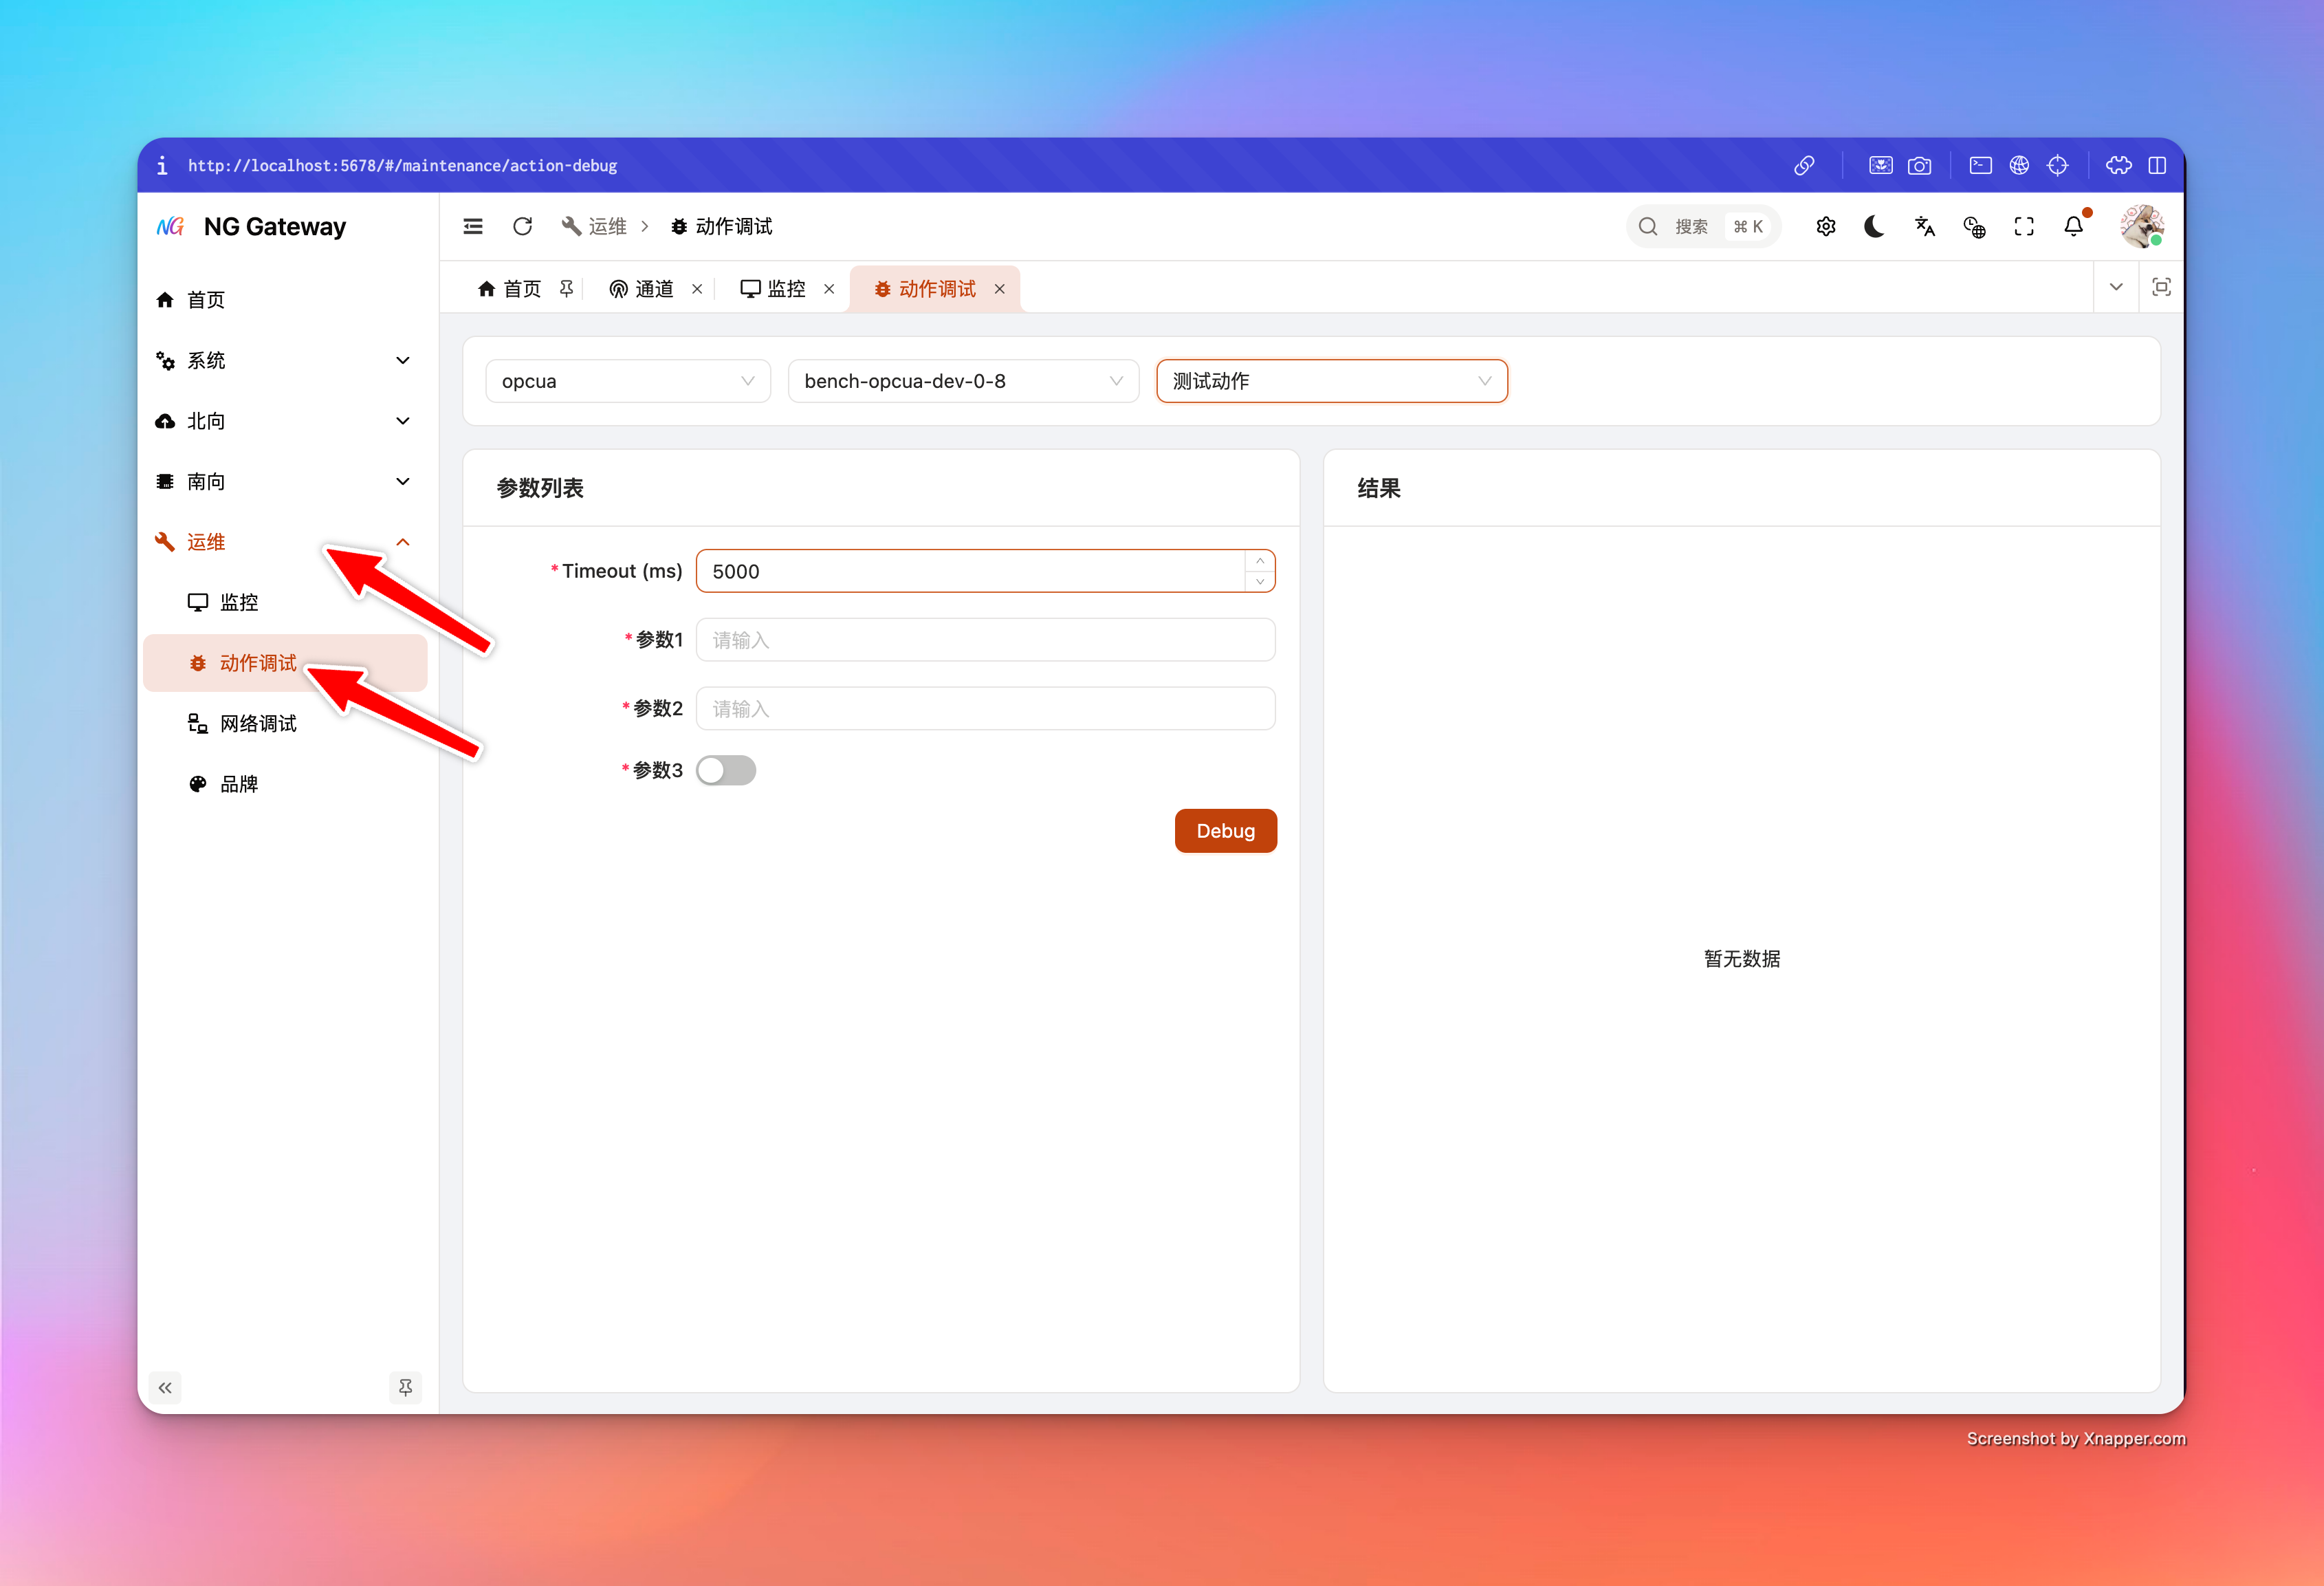
User Guide
- Select Channel
- Used to load device list under this channel
- Select Device
- Used to load Action list associated with this device
- Select Action
- Parameter form initializes after selection (No extra loading skeleton, faster switching)
- Fill Parameters and Execute
- Click "Test/Execute" (UI Text:
page.southward.action.test) - Right side displays JSON result
- Click "Test/Execute" (UI Text:
"Type Rules" of Parameter Form
Action Debug renders components based on Action input parameter definition, key rules:
- Logical Type First: If parameter has
transformDataType, UI uses it as "User Understandable" logical type; otherwise uses rawdataType - Boolean: Render as Switch
- Numeric Type:
- Integer (Including Timestamp) renders as
InputNumber, step 1 - Float (Float32/Float64) renders as
InputNumber, step 0.01 - If parameter defines
minValue/maxValue, form synchronizes input range
- Integer (Including Timestamp) renders as
- Other Types: Default render as text input
Input
Built-in Parameter:
- timeoutMs: Debug request timeout (Default 5000ms). This is timeout for "This Debug Call", not equivalent to device side real execution duration.
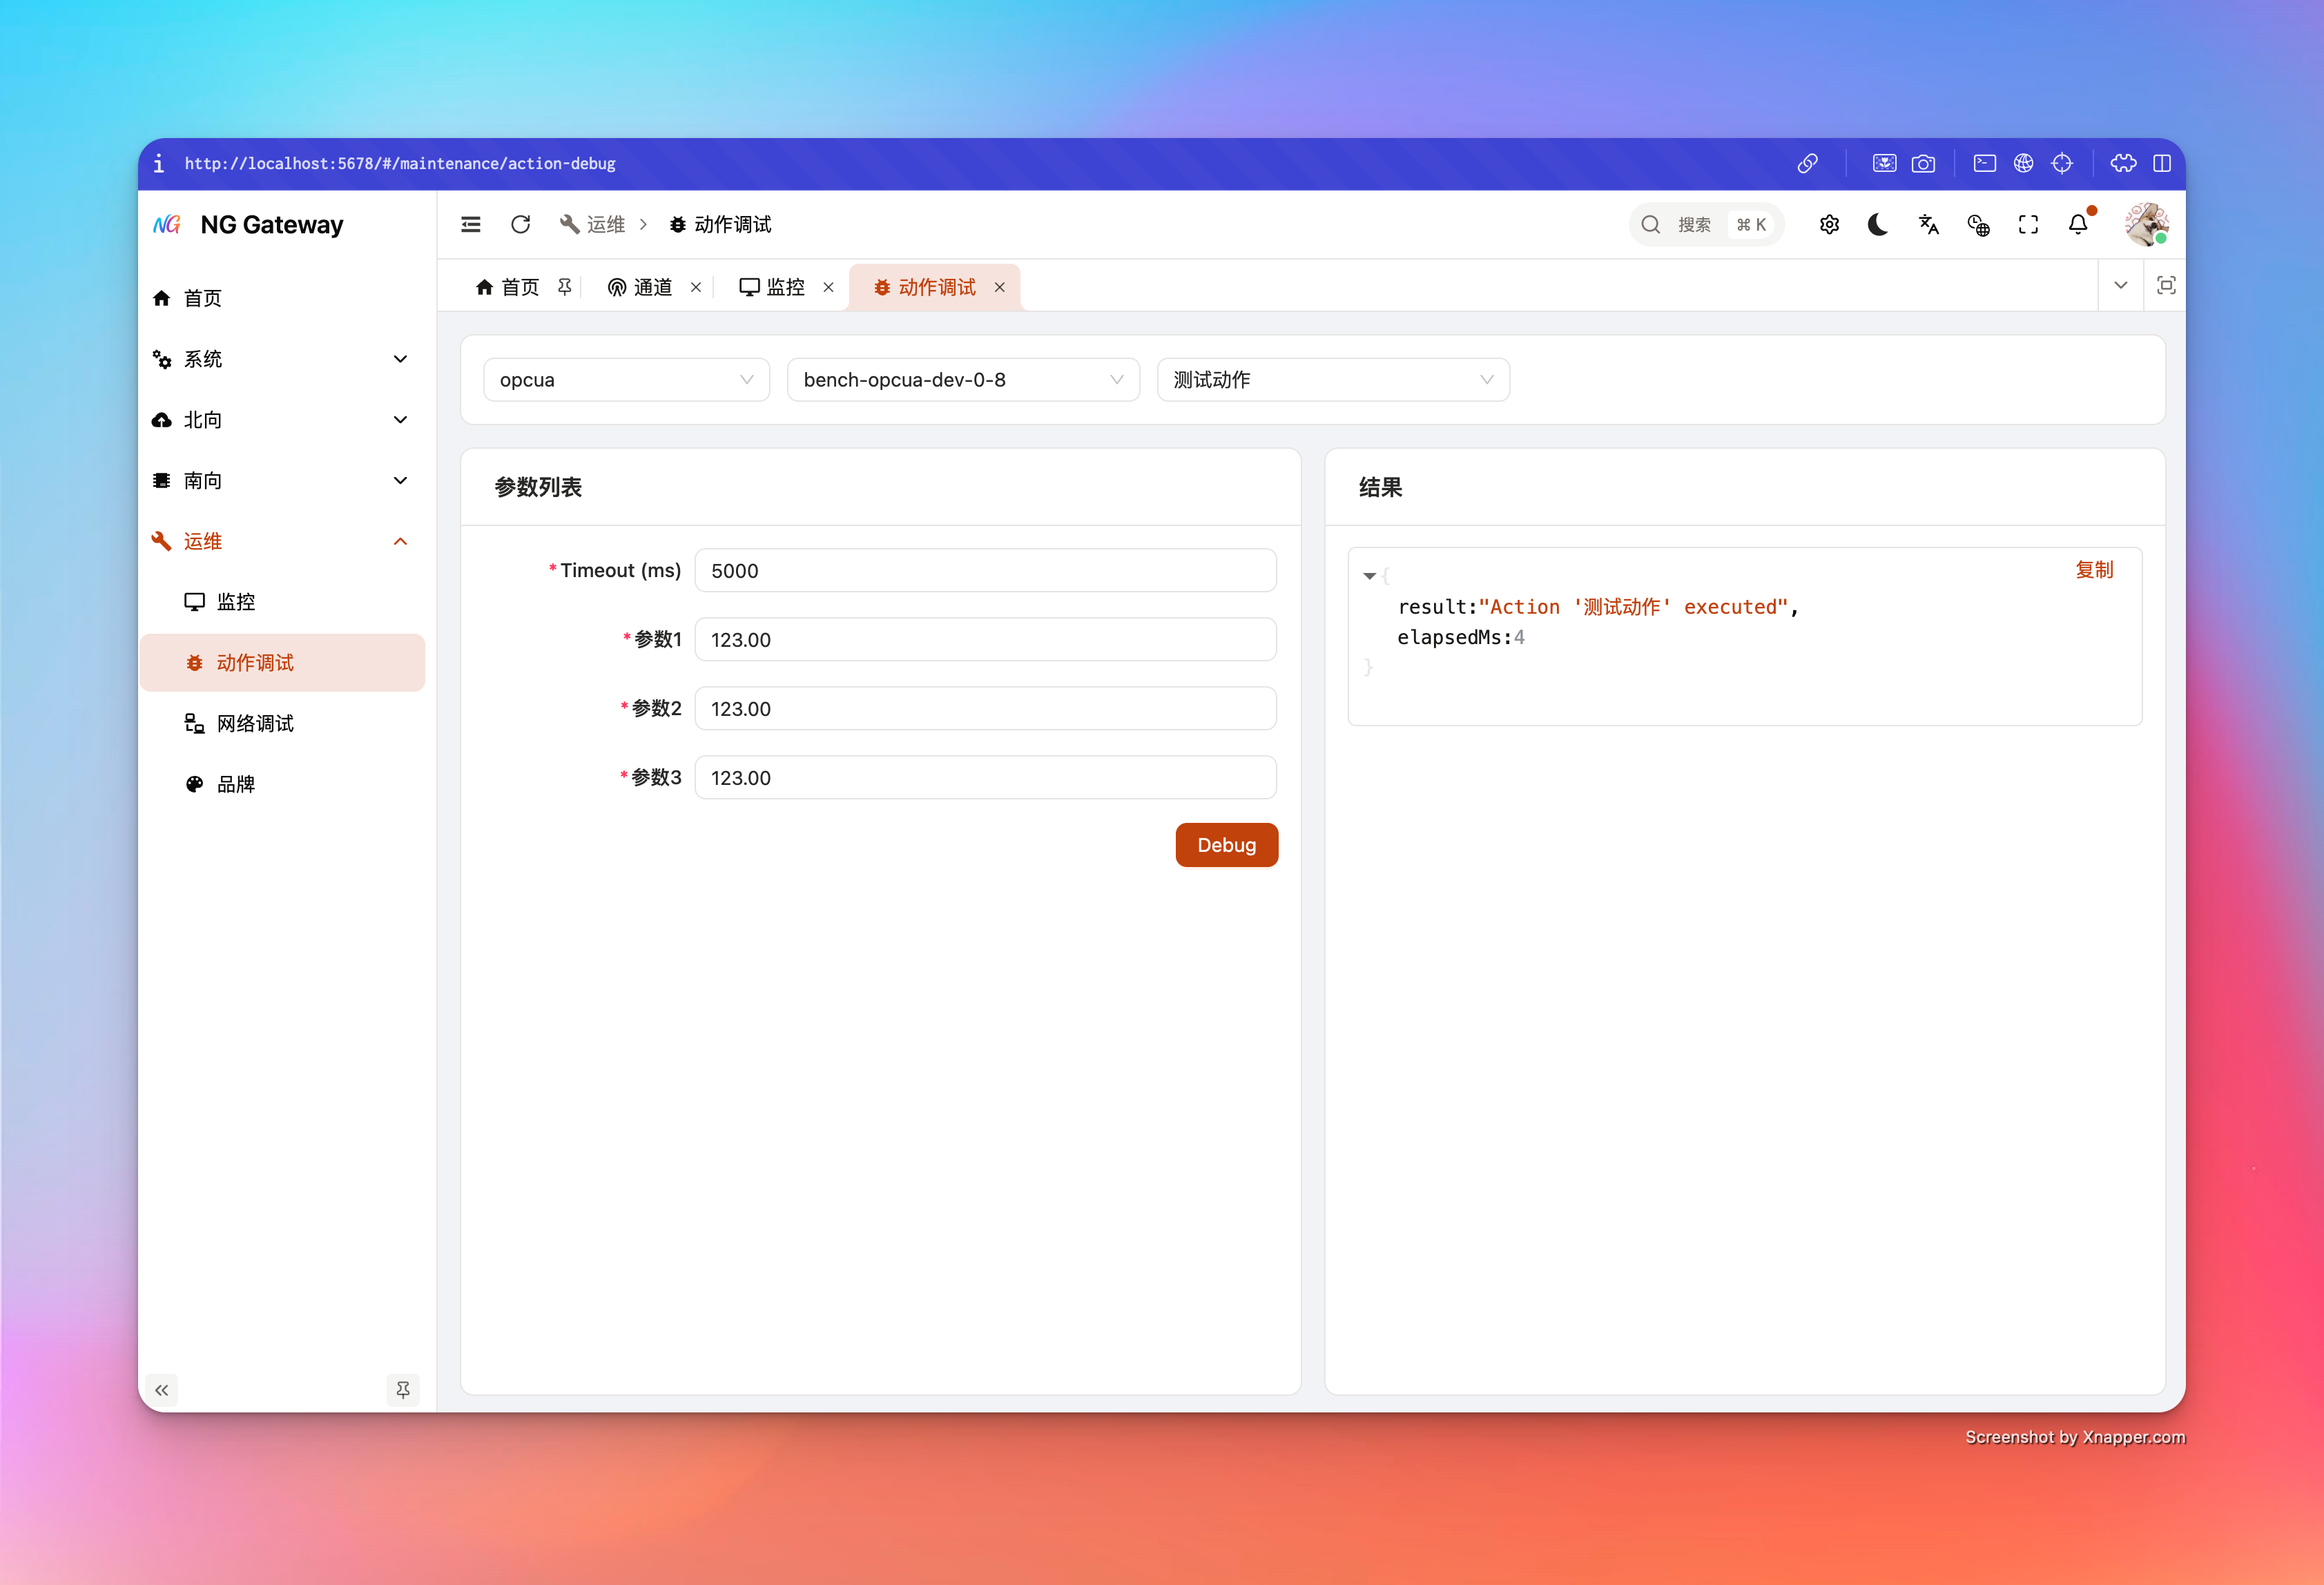
Return Result Description
Debug interface returns:
- result: Structured result returned by driver/executor (JSON)
- elapsedMs: Gateway side elapsed time (ms)
UI displays in JSON format, supports copy.
Best Practices
- Verify connectivity with shortest path first
- Use a "Lightweight Action" (e.g., Read Version/Read Status) to verify device link first
- Then execute "Side-effect Action"
- Timeout setting follows "Two-stage"
- Use short timeout (e.g., 3~5s) for first integration to get failure feedback quickly
- After confirming device indeed needs longer time, gradually increase timeout (Avoid mistaking "Device Unreachable" for "Just Slow")
- Cooperate with Temporary Log Level (TTL)
- Only increase log level of target Channel/App temporarily when needed (e.g., DEBUG 5 mins)
- Auto rollback upon expiration, controlling cost (See
Configuration Management)
FAQ
1) Action List Empty
- Device has no Action configured yet
- Device not under this channel (Check channel/device selection)
- List filtered due to insufficient permission (Check RBAC)
2) Return Timeout after Execution
- Device offline or link unreachable
- Device execution time exceeds
timeoutMs - Downlink protocol itself is "No Response Semantics" (Execute success but no return packet)
Suggestion:
- Use "Net Debug" to verify target address/port reachability first (See
Net Debug) - Temporarily set target Channel log to DEBUG, observe driver downlink and retry info (See
Configuration Management)
3) Error info in result but I don't understand
- Copy JSON result and analyze with logs
- If protocol error, usually need to check parameter range, address, data type mapping