Data Monitor
"Data Monitor" is used to view Telemetry and Attributes (client/shared/server) of a device in real-time in the management console, suitable for field troubleshooting and integration verification: You can quickly answer "Is device reporting", "Is value changing", "When was last update".
Applicable Scenarios
- Field Troubleshooting: Device data intermittent, high latency, suspected data loss, quickly confirm if gateway side has collected latest value
- Integration Verification: Driver/Point mapping just changed, confirm if key is correct, if value changes as expected
- Decouple from Northward Link: Confirm "Collection is normal" first, then check "Cloud upload is normal", avoid guessing both ends
Telemetry vs Attributes
- Telemetry: Usually represents high-frequency collected/reported time-series data (Point value, sensor data, etc.)
- Attributes: Usually represents relatively static or low-frequency changing attributes
- client: Attributes reported by device/client side
- shared: Attributes issued/shared by platform side
- server: Attributes maintained by server side
In monitor table, sourceType identifies whether current row comes from telemetry or attributes.
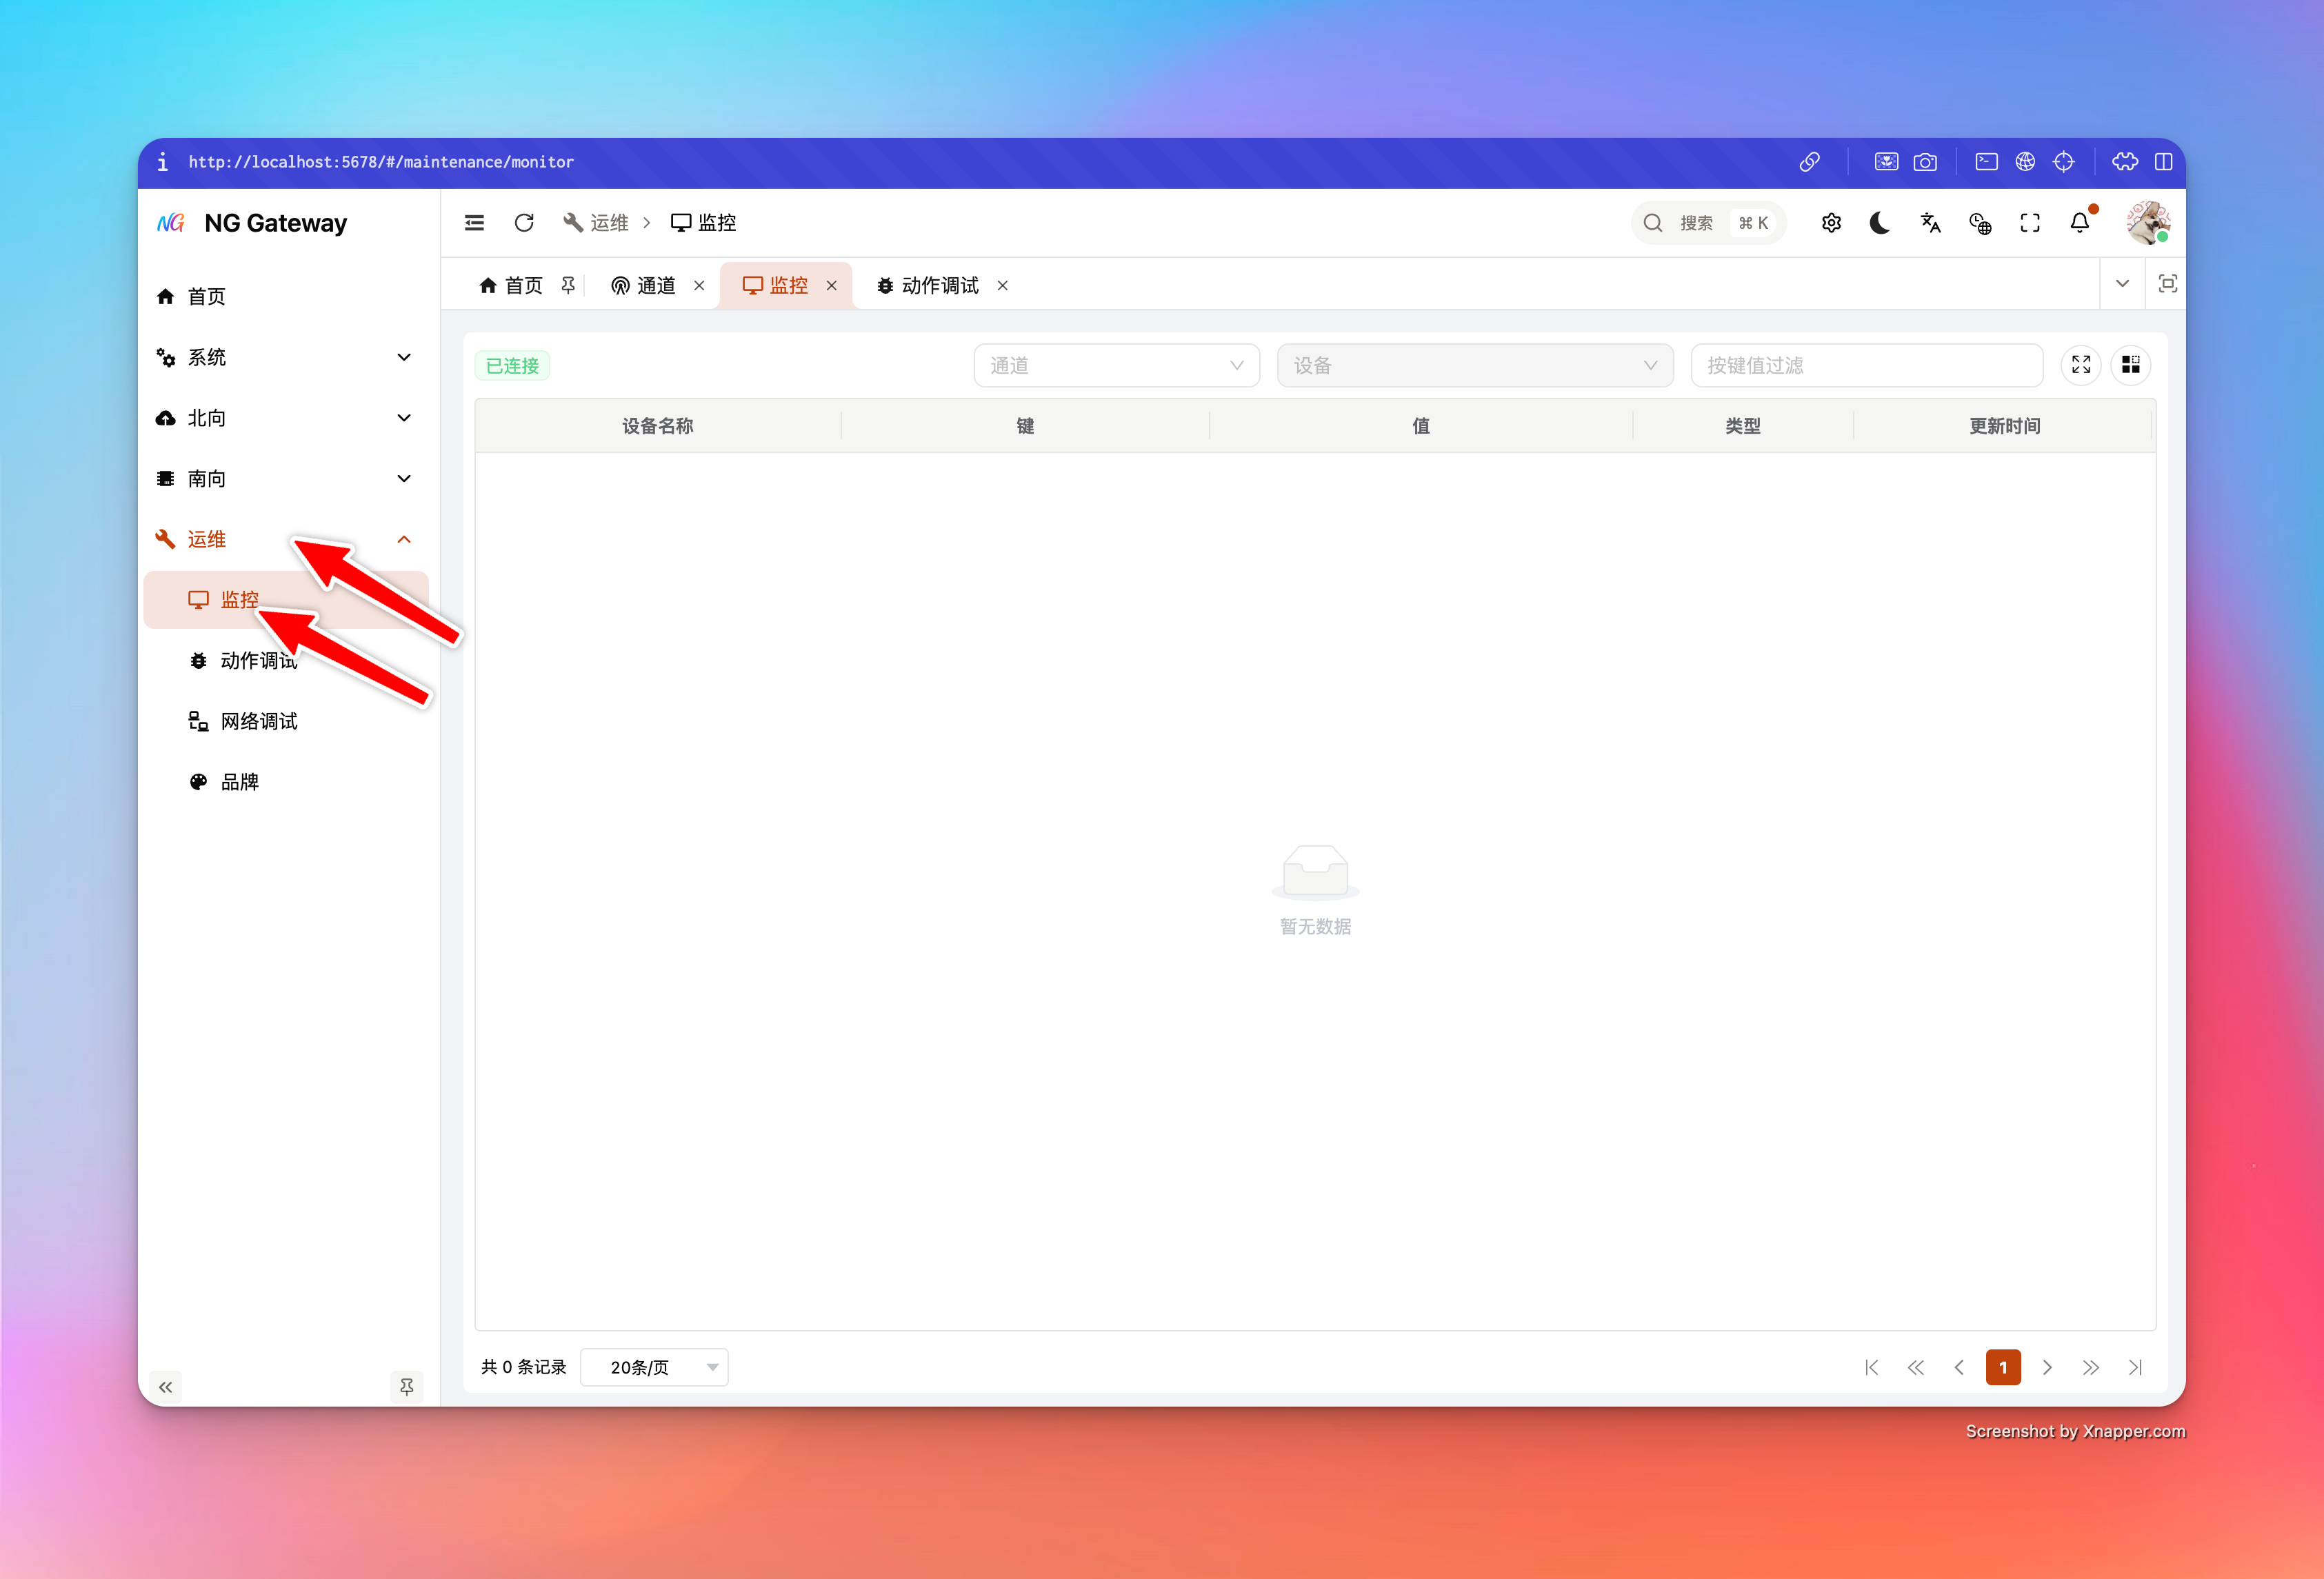
User Guide
- Select Channel
- Used to load device list under this channel, avoid blind selection in large number of devices
- Select Device
- Establish WebSocket connection and subscribe to data stream of this device after selection
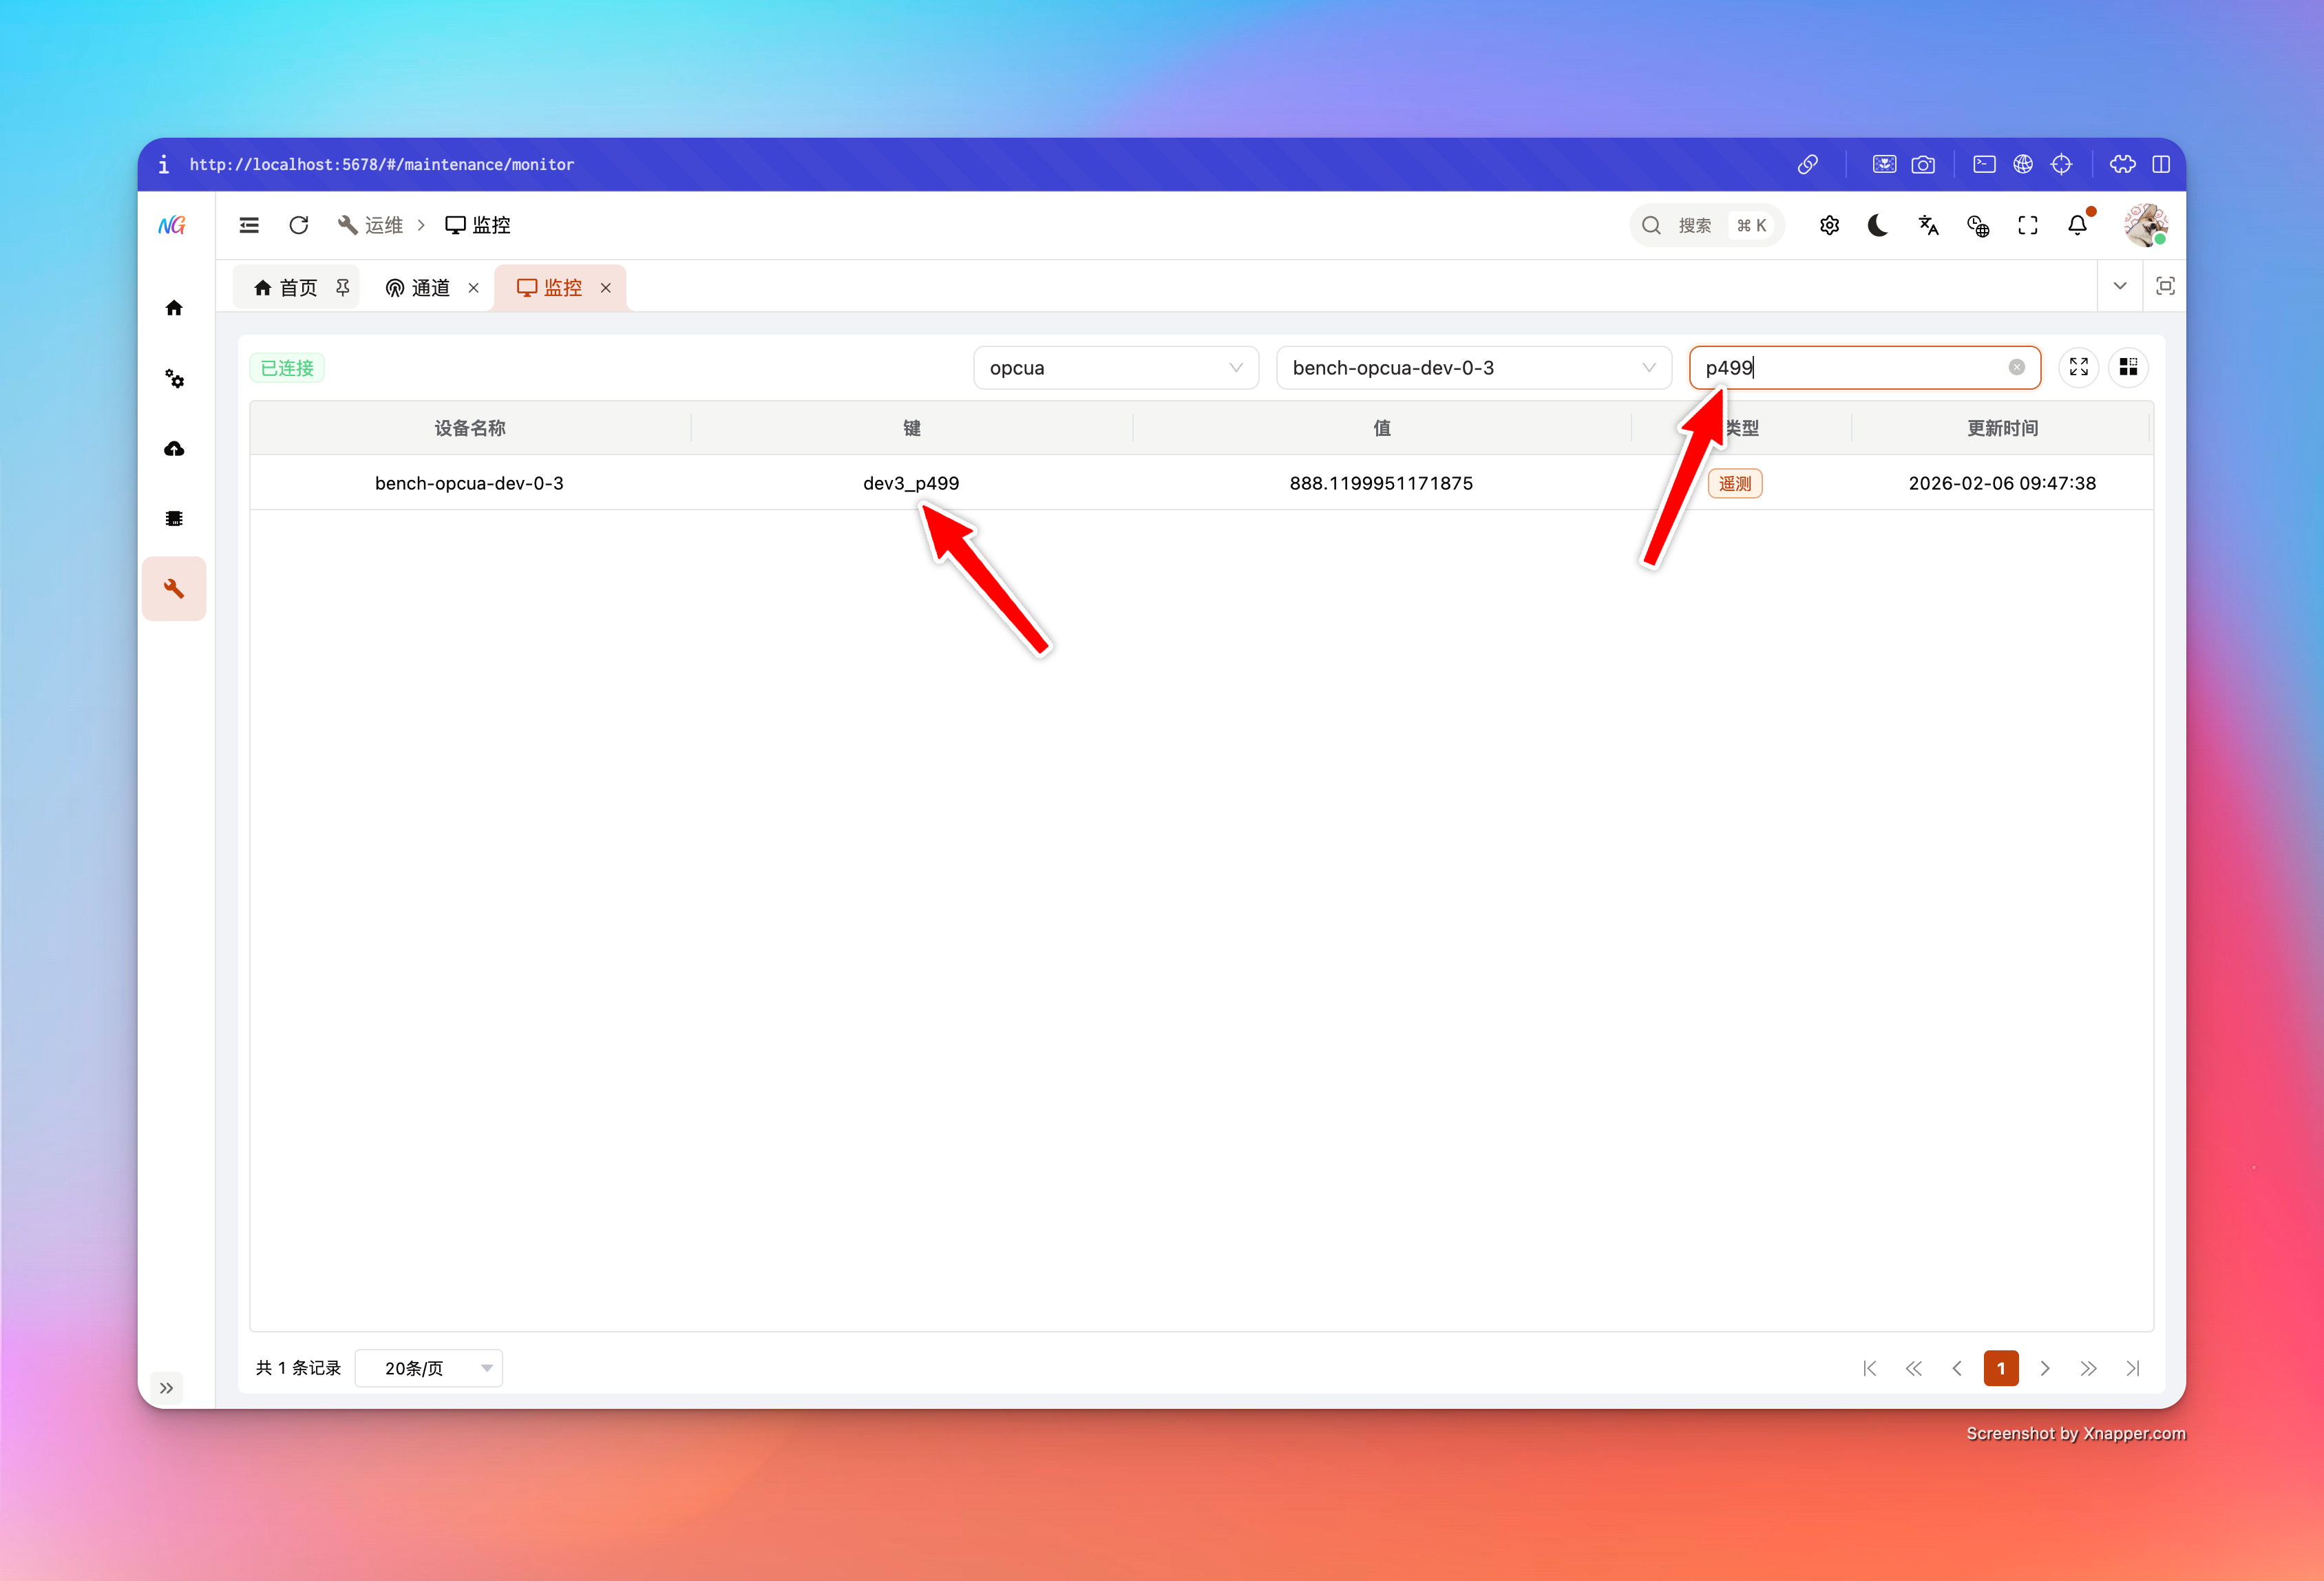
- Search by Key
- Input keyword in "Search Box", filter by
key(Case insensitive)
- Input keyword in "Search Box", filter by
- View Table Fields
- Device Name: Device Name
- Key: Point key / Attribute key
- Value: Current value (May be object/array etc. complex JSON)
- Source Type:
telemetryorattributes - Last Update: Last update time of this device (Server timestamp)
Refresh Semantics and Performance Boundary
To ensure stable usage in "High Throughput + High Frequency Point" scenarios, monitor link implements two layers of "Rate Limit/Merge":
- Server-side Merge (200ms Window): Server merges point updates of same device within short window before pushing, avoiding UI being flooded by one frame per point
- Frontend Throttle (200ms Min Refresh Interval): Frontend throttles UI update, avoiding frequent table redraw
In addition, table rendering implements pagination optimization:
- Render Current Page Values Only: Only "Inject realtime value" for current page rows during pagination, controlling refresh cost to (O(pageSize)), avoiding browser lag when point quantity is large
Known Limitations and Notes
- Need "Device Snapshot" First: Monitor depends on latest snapshot of device on gateway side; if device never reported data, may not display any row
- Suggest confirming first: Is device connected, collection started, data reported to gateway
- Ambiguity of Same Name Attribute Key: Same key may exist in
client/shared/serversimultaneously, UI internally distinguishes rows by scope (Avoid conflict)
FAQ
1) What if Connection Status shows "Disconnected/Connecting/Reconnecting"?
- Check API Gateway Address and Network First: Can browser access gateway management port
- Check Auth Status: Is login expired (WS may be rejected after expiration)
- Check Browser Console: If WebSocket connection rejected/401/403, usually permission or auth issue
2) Selected Device but Table Shows No Data?
- Device Has Not Produced Snapshot: Monitor cannot display key list when device never successfully collected/reported data
- Driver/Channel Not Started or Connection Failed: Check channel connection status and collection status first
- Confirm Point Model: No point configured/No uplink output, telemetry keys will not appear either
3) Value Shows undefined or Empty?
- The key may exist in "Metadata List", but current snapshot does not contain value yet (e.g., newly added key, not reported yet)
- Suggest waiting for next device report or resubscribe (Switch device and switch back)
Troubleshooting Suggestions
- Check Metrics and Backpressure First: If queue backpressure or drops are obvious, realtime monitor may also have delay
- Then Divide Direction: Is southward collection normal? Is northward upload normal?