OPC UA Benchmark
This document records the performance benchmark process and results of NG Gateway for the OPC UA protocol. The tests run the gateway in a resource-constrained Docker container (1 CPU / 1 GB memory), using an external OPC UA simulation server to provide real protocol interaction workloads, and leveraging a Prometheus + Grafana + cAdvisor monitoring stack to collect container-level resource metrics in real time, systematically evaluating the gateway as an OPC UA client under different collection scales and frequencies for resource consumption and operational stability.
The tests cover the following dimensions:
- Collection Scale Gradient: From a single channel with 10 devices (10,000 points) scaling up to 10 channels with 100 devices (100,000 points)
- Collection Frequency Comparison: Standard cycle (1000 ms) vs. high-frequency collection (100 ms)
- Mixed Workload Stress Test: Large-scale data collection combined with concurrent random command dispatching
Test Environment
Hardware Platform
| Item | Specification |
|---|---|
| CPU | 4 Cores |
| Memory | 24 GB |
| OS | Debian GNU/Linux 12 |
Gateway Deployment
The gateway is deployed as a docker compose container with resource limits to simulate a constrained edge-side environment:
| Resource | Limit | Reservation |
|---|---|---|
| CPU | 1.0 Core | 0.5 Core |
| Memory | 1000 MiB | 256 MiB |
TIP
Resource constraints are configured via Docker Compose deploy.resources.limits, consistent with Kubernetes Pod resource quota semantics.
docker-compose.yaml
services:
  gateway:
    image: ${GATEWAY_IMAGE:-shiyuecamus/ng-gateway}:${GATEWAY_TAG:-latest}
    container_name: ng-gateway
    restart: unless-stopped
    ports:
      - "${GATEWAY_HTTP_PORT:-8978}:5678"
      - "${GATEWAY_WS_PORT:-8979}:5679"
    volumes:
      - gateway-data:/app/data
      - gateway-drivers:/app/drivers/custom
      - gateway-plugins:/app/plugins/custom
    deploy:
      resources:
        limits:
          cpus: "${BENCH_CPU_LIMIT:-1.0}"
          memory: "${BENCH_MEM_LIMIT:-1000M}"
        reservations:
          cpus: "${BENCH_CPU_RESERVE:-0.5}"
          memory: "${BENCH_MEM_RESERVE:-256M}"

  cadvisor:
    image: gcr.io/cadvisor/cadvisor:v0.51.0
    container_name: ng-cadvisor
    restart: unless-stopped
    ports:
      - "8080:8080"
    command:
      - --docker_only=true
      - --housekeeping_interval=2s
      - --store_container_labels=true
    volumes:
      - /:/rootfs:ro
      - /var/run:/var/run:ro
      - /var/run/docker.sock:/var/run/docker.sock:rw
      - /sys:/sys:ro
      - /sys/fs/cgroup:/sys/fs/cgroup:ro
      - /var/lib/docker/:/var/lib/docker:ro
      - /dev/disk/:/dev/disk:ro
    privileged: true
    devices:
      - /dev/kmsg:/dev/kmsg

  prometheus:
    image: prom/prometheus:latest
    container_name: ng-prometheus
    restart: unless-stopped
    ports:
      - "9090:9090"
    volumes:
      - ./prometheus/prometheus.yml:/etc/prometheus/prometheus.yml:ro
      - ng-prometheus-data:/prometheus
    command:
      - --config.file=/etc/prometheus/prometheus.yml
      - --storage.tsdb.path=/prometheus
      - --web.enable-lifecycle
    depends_on:
      - cadvisor
      - gateway

  grafana:
    image: grafana/grafana:latest
    container_name: ng-grafana
    restart: unless-stopped
    ports:
      - "3000:3000"
    environment:
      GF_SECURITY_ADMIN_USER: admin
      GF_SECURITY_ADMIN_PASSWORD: admin
      GF_USERS_ALLOW_SIGN_UP: "false"
      GF_PATHS_PROVISIONING: /etc/grafana/provisioning
    volumes:
      - ./grafana/provisioning:/etc/grafana/provisioning:ro
      - ./grafana/dashboards:/var/lib/grafana/dashboards:ro
      - ng-grafana-data:/var/lib/grafana
    depends_on:
      - prometheus

volumes:
  ng-prometheus-data:
  ng-grafana-data:
  gateway-data:
  gateway-drivers:
  gateway-plugins:
Test Tools
OPC UA Simulation Server
Prosys OPC UA Simulation Server is used as the OPC UA server simulator. Prosys OPC UA Simulation Server is a fully featured free OPC UA simulation tool supporting the OPC UA TCP binary transport protocol. It can simulate various data type nodes (Analog / Discrete / String, etc.), provides flexible address space configuration and data change simulation (sine, random, increment patterns), and is widely used for OPC UA client development debugging and performance verification.
Simulation Topology:
| Item | Configuration |
|---|---|
| Server Endpoint | opc.tcp://<host>:4840 |
| Simulation Node Type | Analog (Float / Double) |
| Data Change Mode | Periodic random updates |
Mapping Relationship
- Each OPC UA server endpoint maps to a Channel in
ng-gateway— an independent OPC UA session connection - Each logical node group maps to a Device within the channel — collected in batches via the Subscription mechanism for node changes
- Test scenarios create multiple channel connections to the same or different server instances as needed to build different collection workloads
Performance Monitoring Stack
Resource metrics during testing are collected using the cAdvisor + Prometheus + Grafana stack, all orchestrated alongside the gateway container via the same docker compose file:
| Component | Version | Role |
|---|---|---|
| cAdvisor | v0.51.0 | Collects container-level resource metrics: CPU usage, memory (RSS / Cache), network bytes sent/received |
| Prometheus | latest | Scrapes cAdvisor /metrics endpoint every 2s, persists time-series data |
| Grafana | latest | Visualization dashboards with pre-configured cAdvisor Docker container monitoring |
Core Metrics Collected:
| Metric | Prometheus Metric | Description |
|---|---|---|
| CPU Usage | container_cpu_usage_seconds_total | CPU usage percentage per container |
| Memory Usage | container_memory_rss | Resident Set Size |
| Network Receive | container_network_receive_bytes_total | Total bytes received (rate computed) |
| Network Transmit | container_network_transmit_bytes_total | Total bytes transmitted (rate computed) |
Quick Start:
cd deploy/compose/bench && docker compose up -d| Service | Access URL |
|---|---|
| Grafana | http://localhost:3000 (admin / admin) |
| Prometheus | http://localhost:9090 |
| cAdvisor | http://localhost:8080 |
| ng-gateway | http://localhost:8978 |
Summary
Data Collection Performance
| Scenario | Channels | Devices/Channel | Points/Device | Frequency | Total Points | Type | Memory | CPU | Network Bandwidth |
|---|---|---|---|---|---|---|---|---|---|
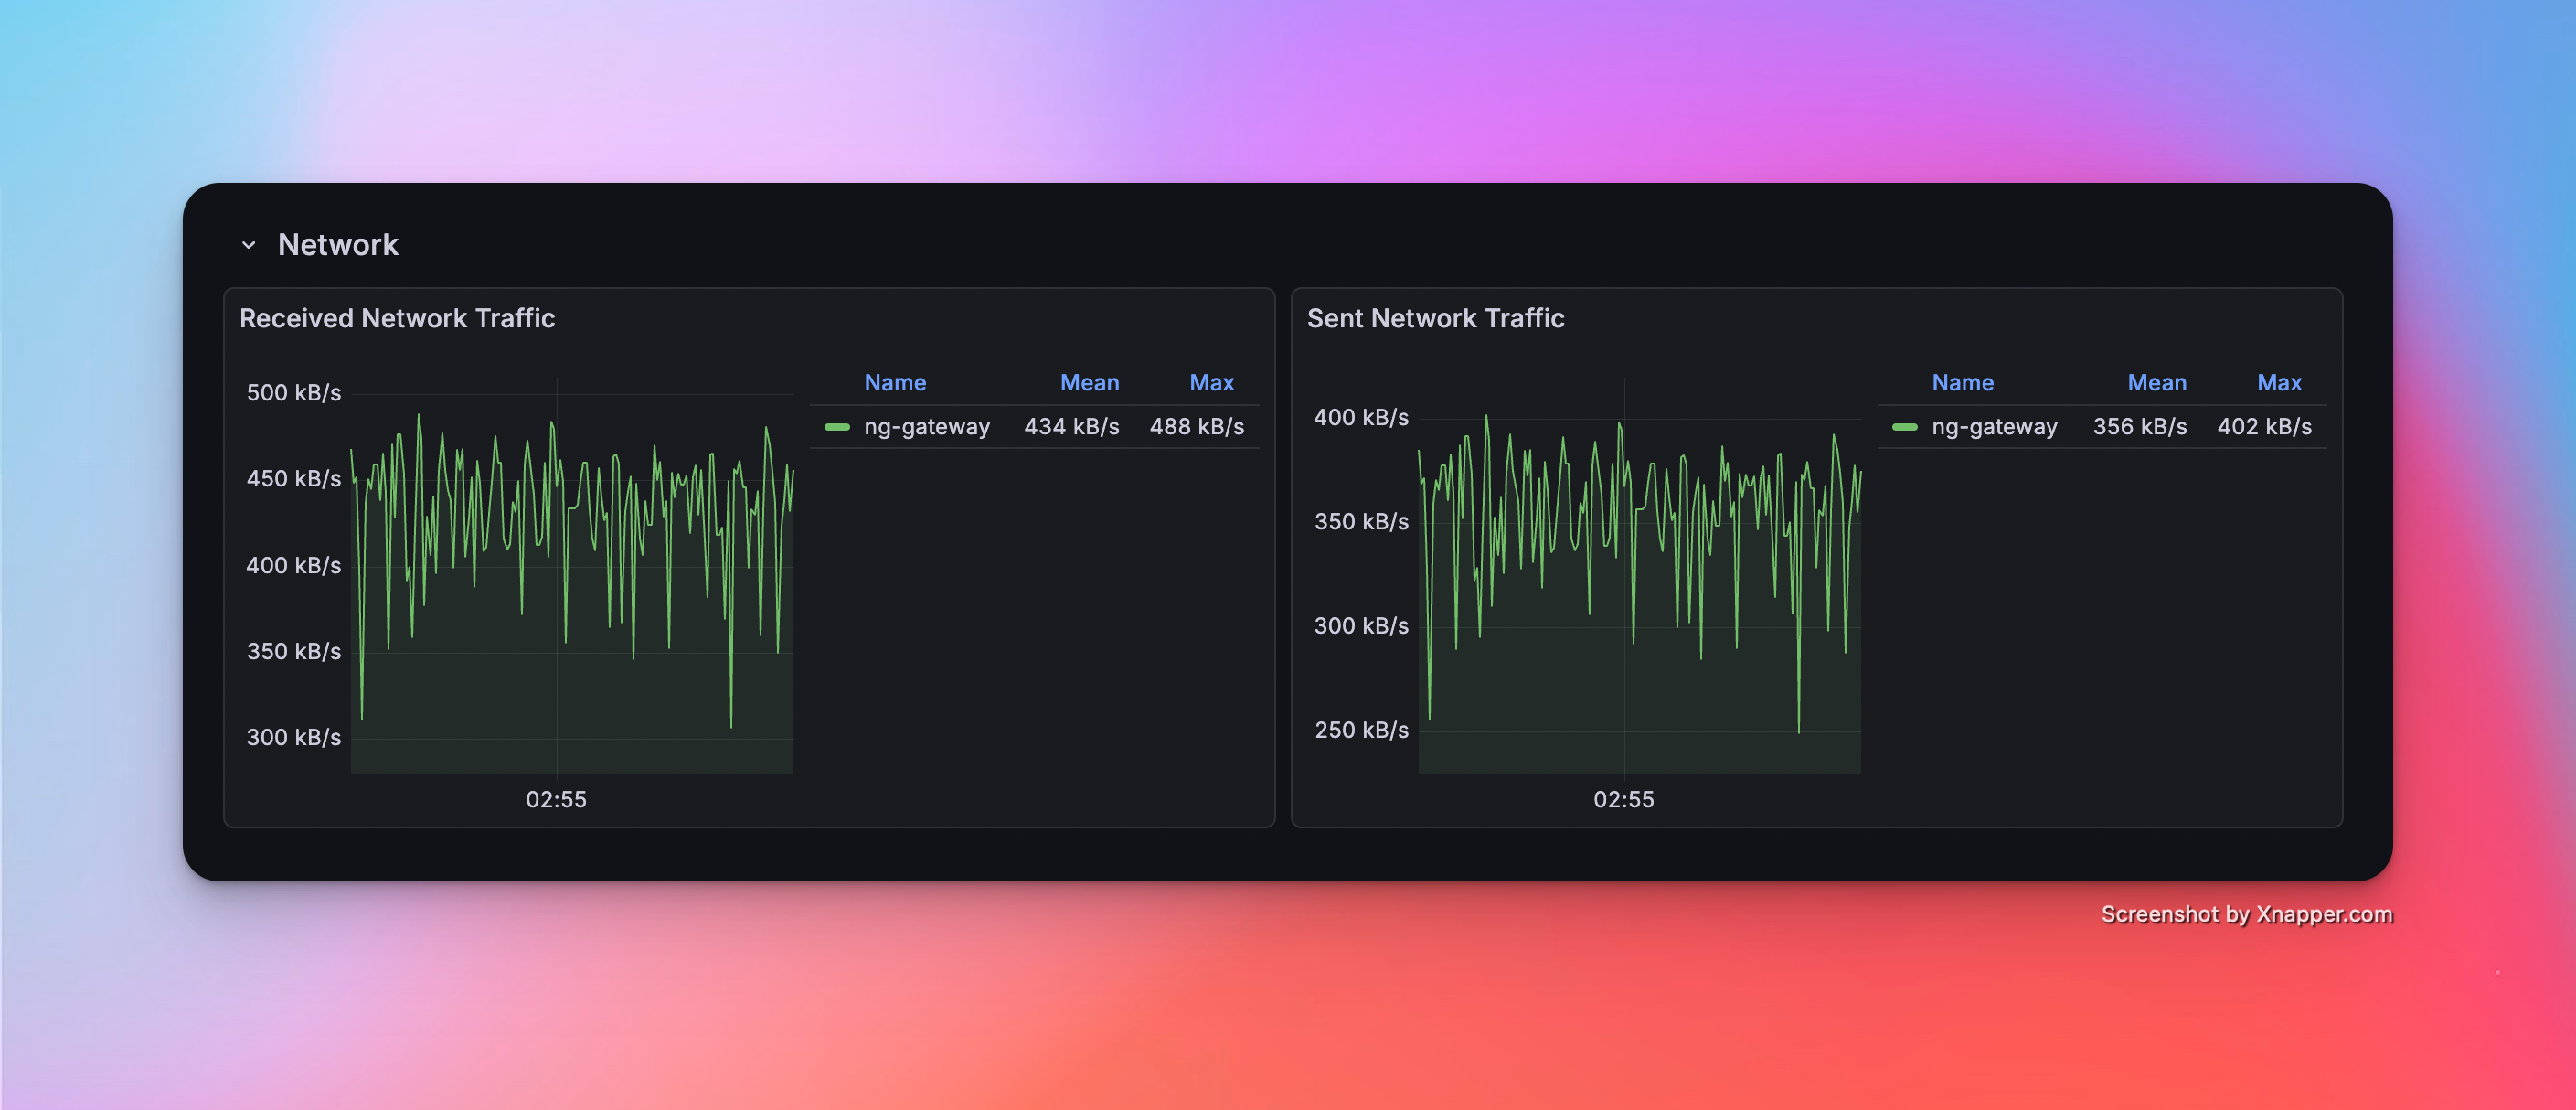
| 1 | 1 | 10 | 1,000 | 1000 ms | 10,000 | Float32 | 67.1 MiB | 3.12% | rx: 434.0 kB/s tx: 356.0 kB/s |
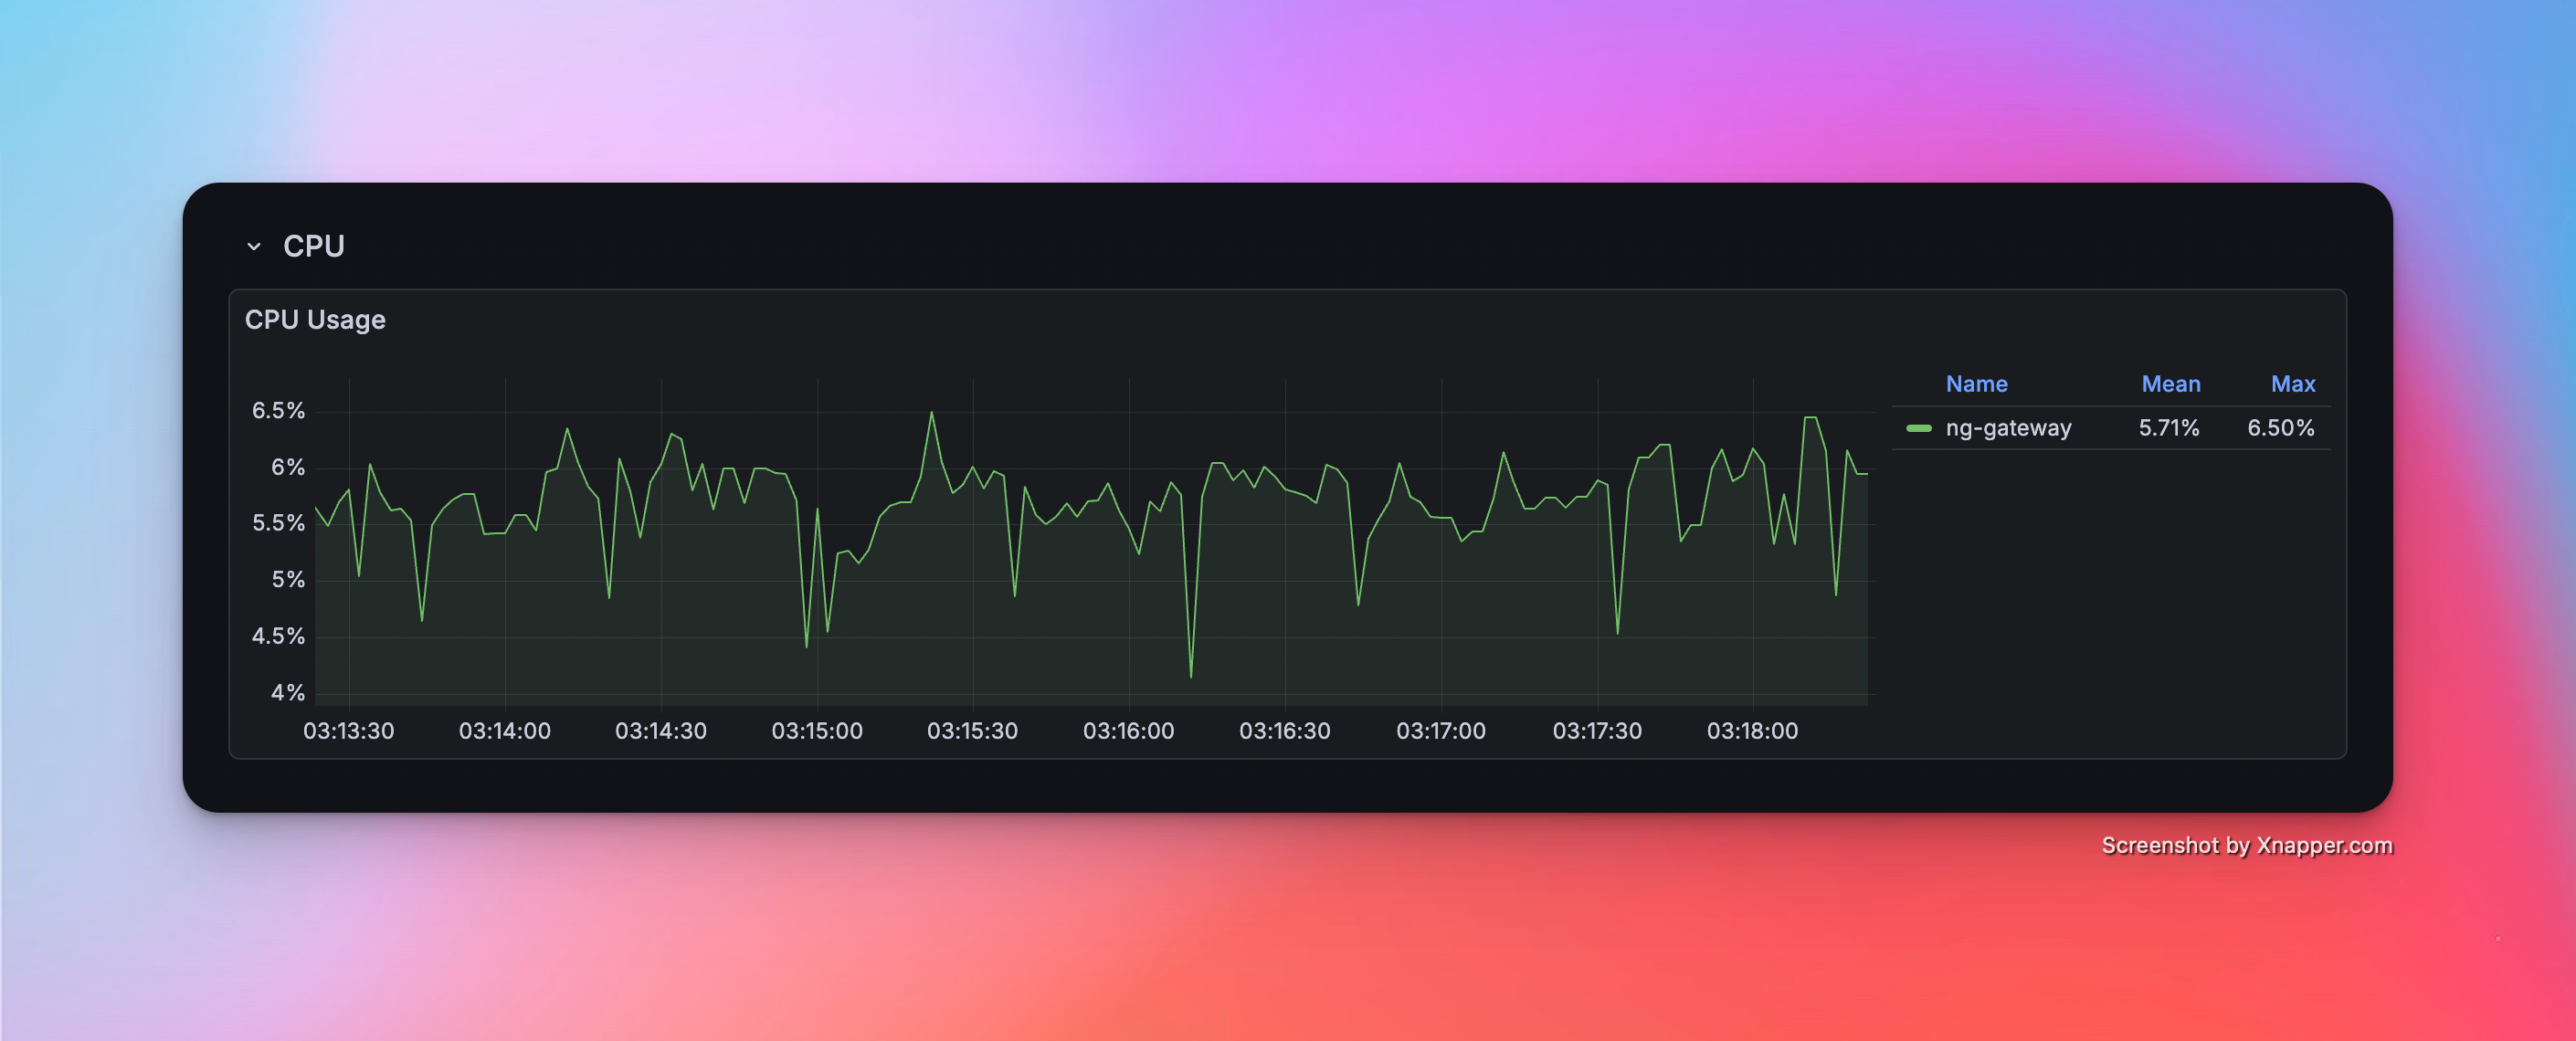
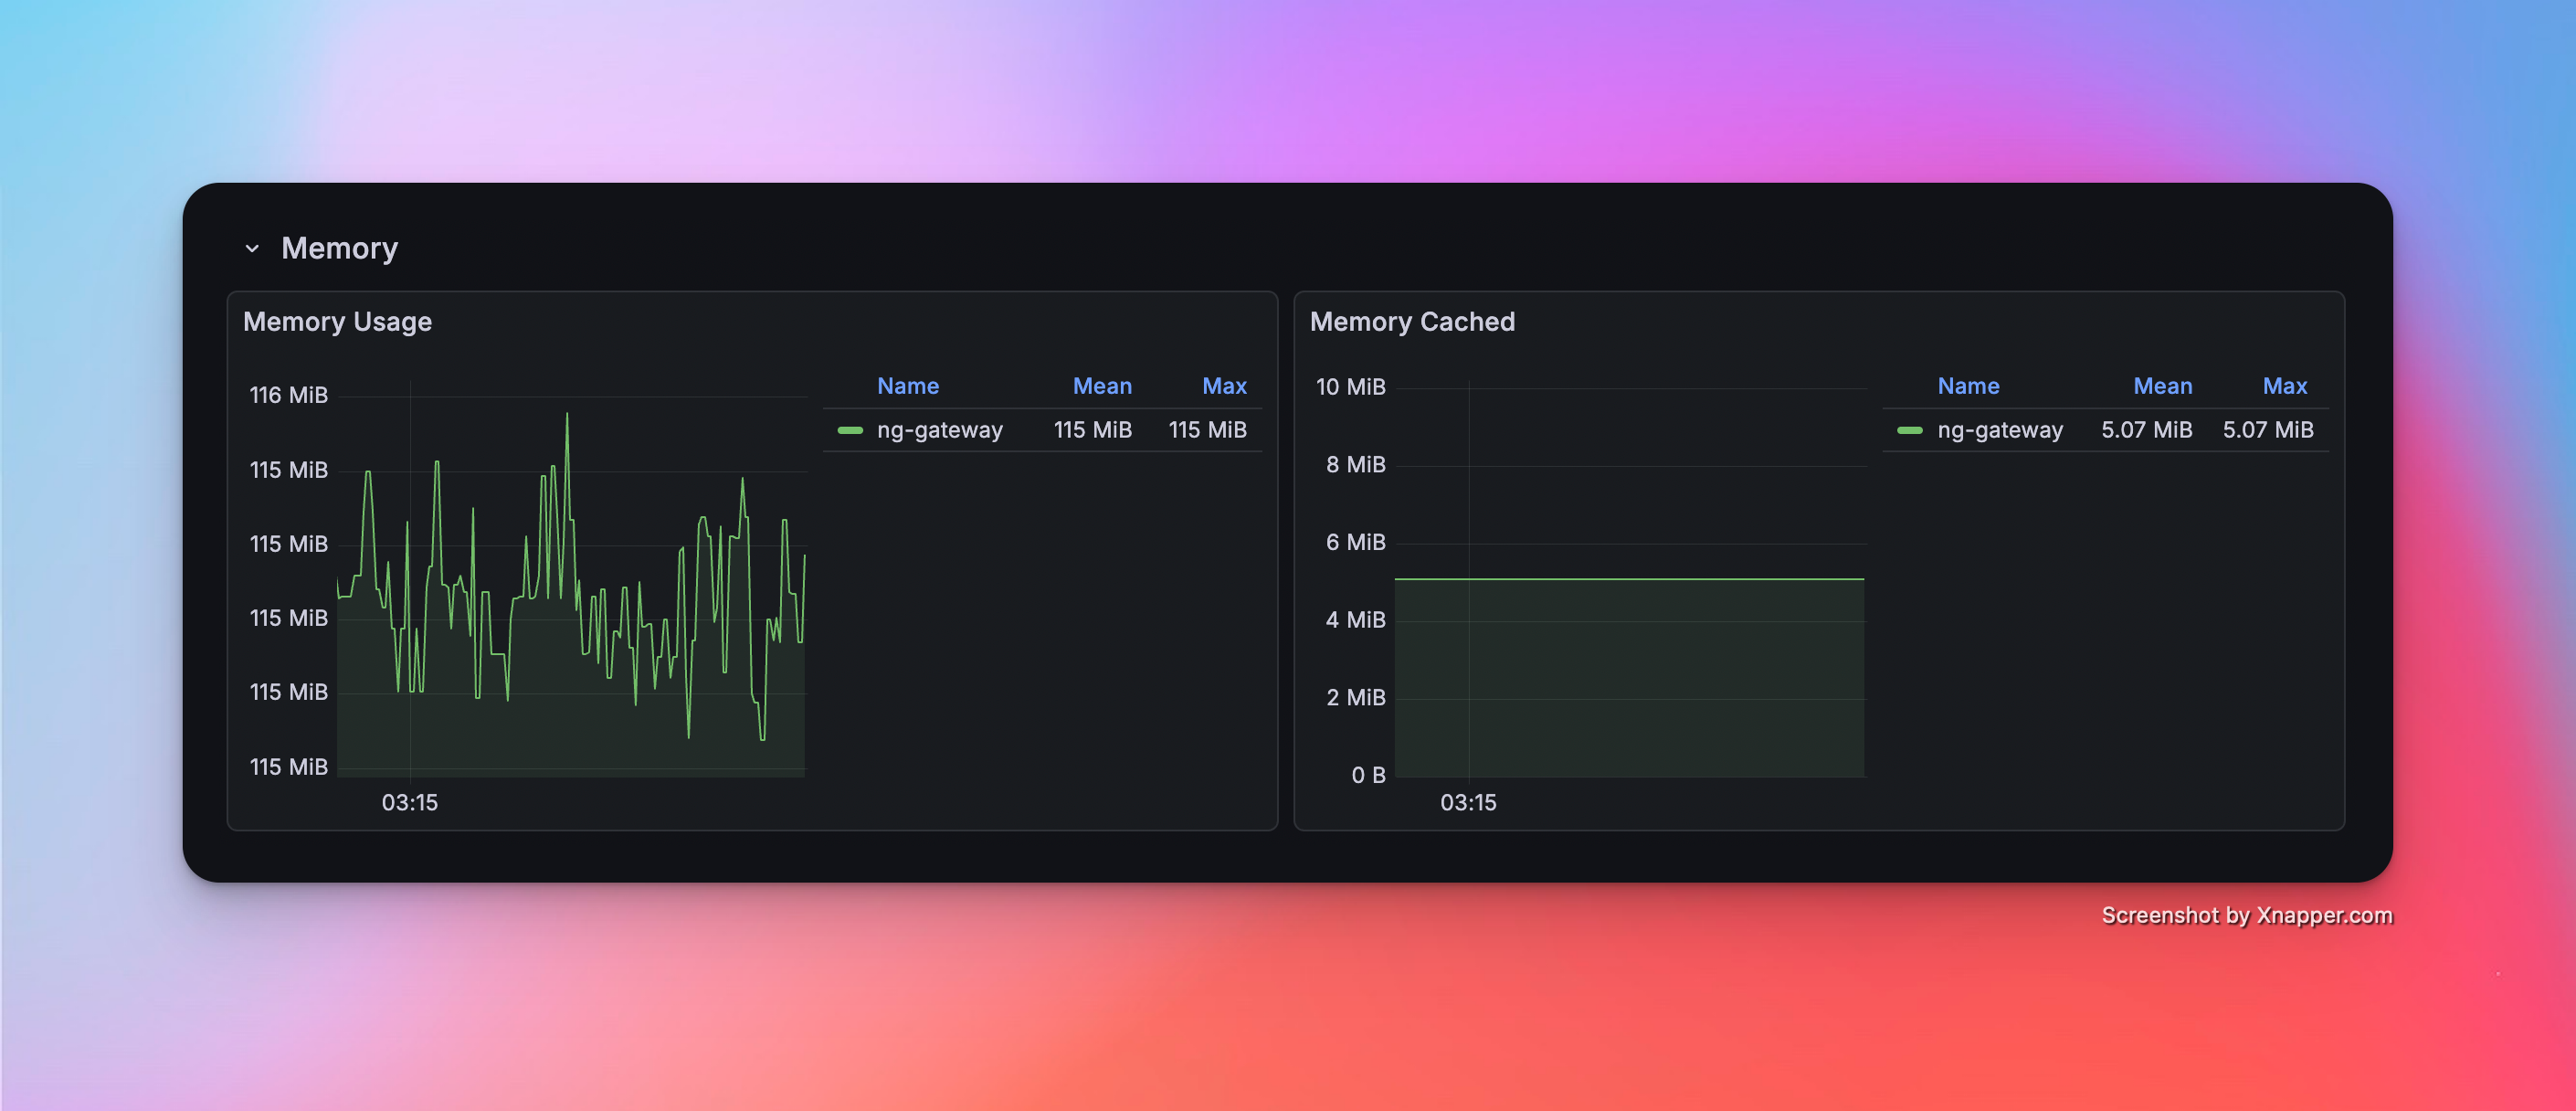
| 2 | 5 | 10 | 1,000 | 1000 ms | 50,000 | Float32 | 115.0 Mib | 5.71% | rx: 1.32 MB/s tx: 1.19 MB/s |
| 3 | 10 | 10 | 1,000 | 1000 ms | 100,000 | Float32 | 165.0 MiB | 8.28% | rx: 2.38 MB/s tx: 1.95 MB/s |
| 4 | 1 | 1 | 1,000 | 100 ms | 1,000 | Float32 | 45.0 MiB | 3.50% | rx: 216.0 kB/s tx: 178.0 kB/s |
| 5 | 5 | 1 | 1,000 | 100 ms | 5,000 | Float32 | 51.6 MiB | 6.82% | rx: 1.08 MB/s tx: 887.0 kB/s |
| 6 | 10 | 1 | 1,000 | 100 ms | 10,000 | Float32 | 56.3 MiB | 9.48% | rx: 2.16 MB/s tx: 1.78 MB/s |
| 7 | 10 | 10 | 1,000 | 1000 ms | 100,000 | Float32 | 165.0 MiB | 8.28% | rx: 2.38 MB/s tx: 1.95 MB/s |
Mixed Load Performance
| Scenario | Channels | Devices/Channel | Points/Device | Frequency | Total Points | Type | Downlink Method | Downlink Points | Iterations | Min Latency | Max Latency | Avg Latency |
|---|---|---|---|---|---|---|---|---|---|---|---|---|
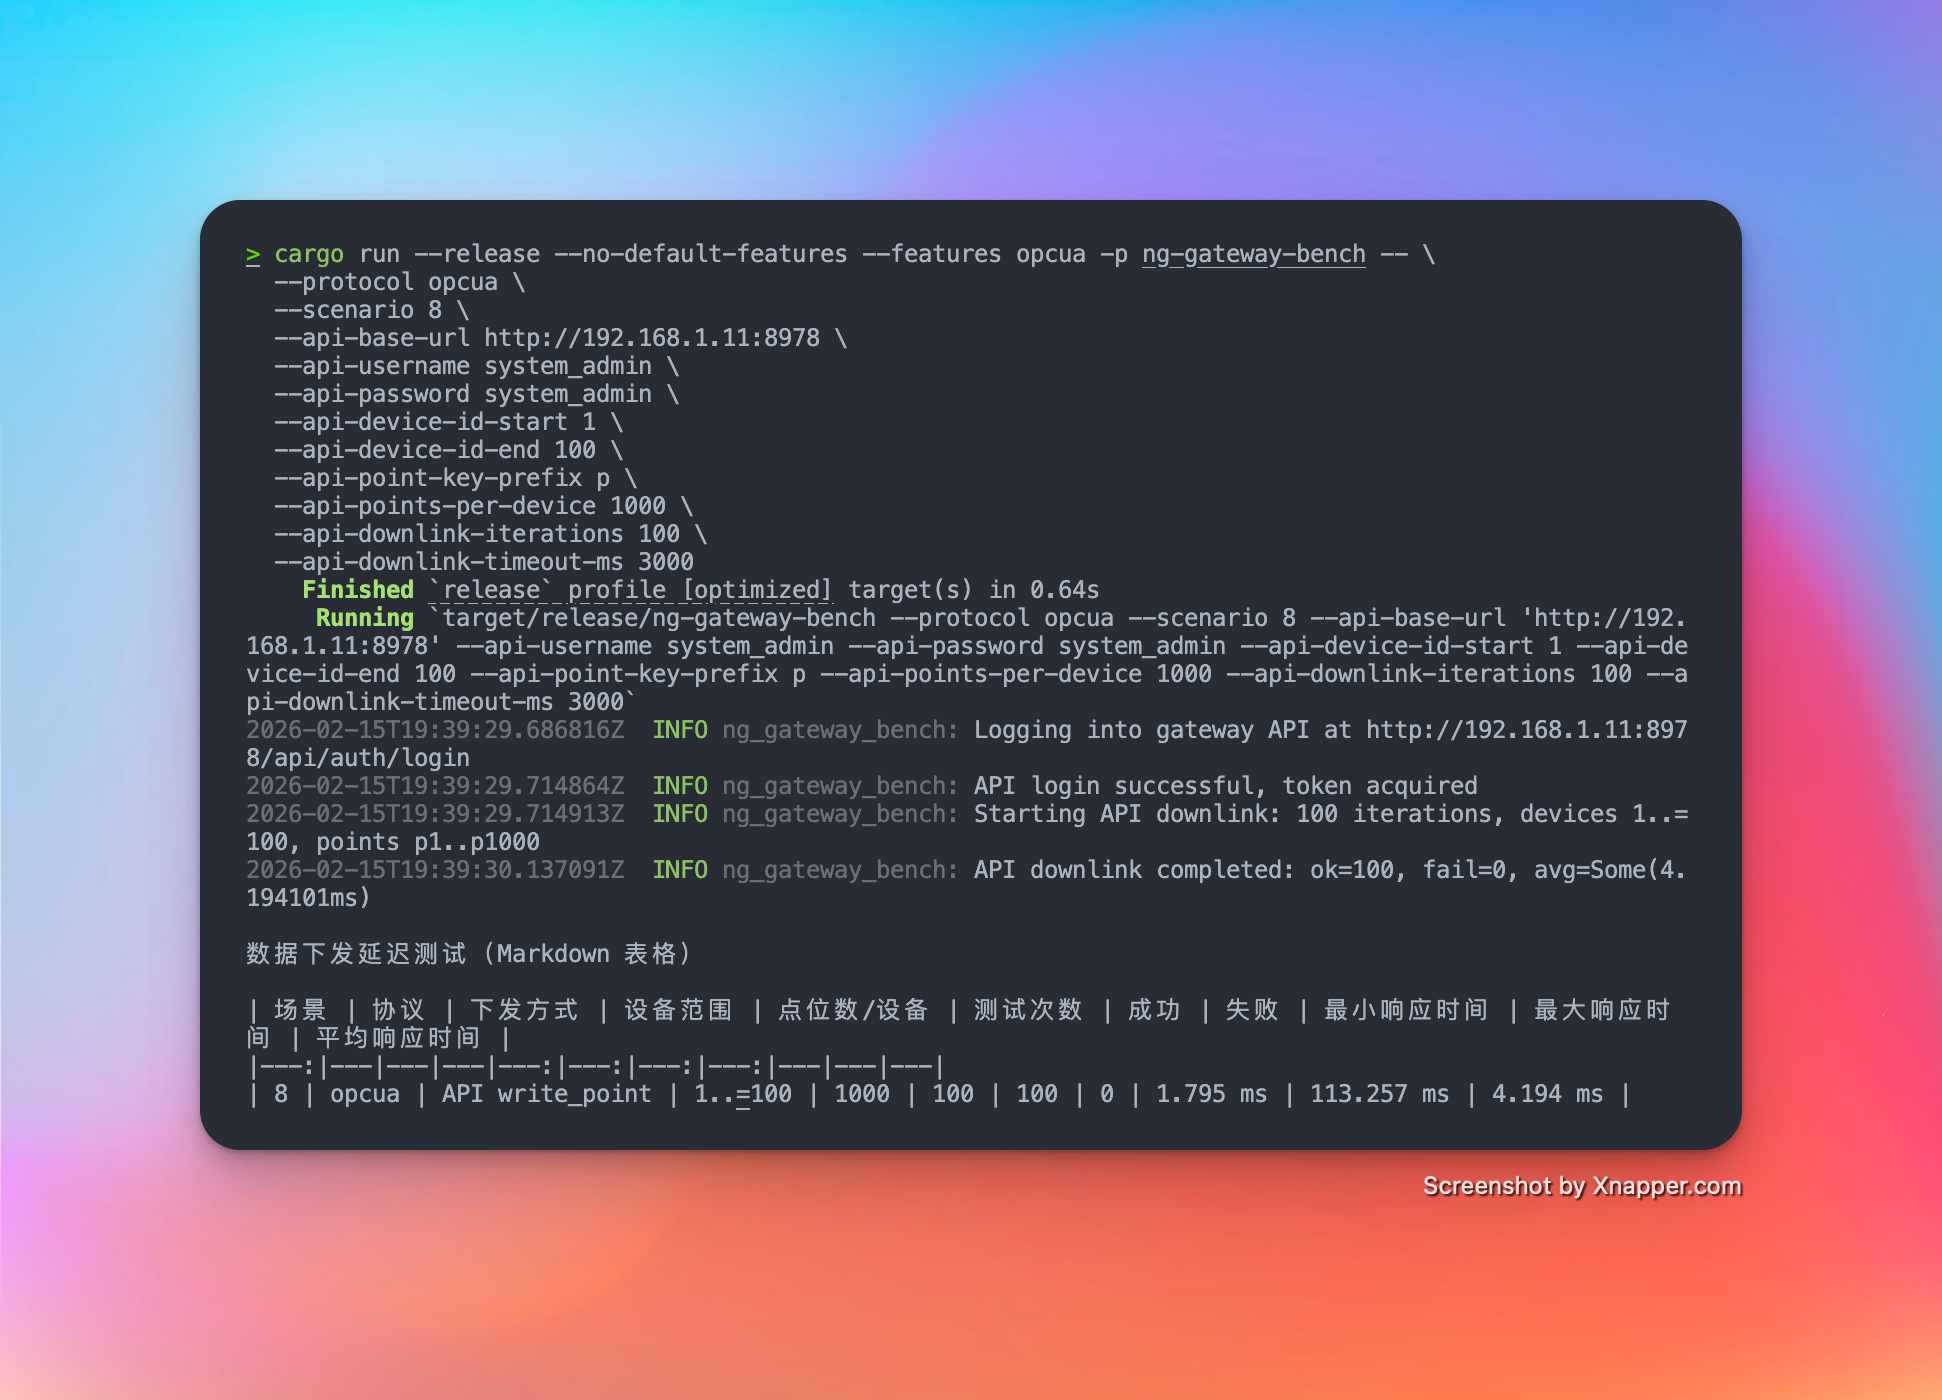
| 7 | 10 | 10 | 1,000 | 1000 ms | 100,000 | Float32 | API | 100 | 100 | 1.795 ms | 113.257 ms | 4.194 ms |
Test Scenarios & Results
Scenario 1: Basic Collection
- Config: 1 Channel · 10 Devices · 1,000 Points/Device · 1000 ms Period (Total 10,000 Points)
Metrics
| Memory | CPU | Network Bandwidth |
|---|---|---|
| 67.1 MiB | 3.12% | rx: 434.0 kB/s tx: 356.0 kB/s |
Resource Monitor Screenshots


Scenario 2: Medium Scale Collection
- Config: 5 Channels · 10 Devices · 1,000 Points/Device · 1000 ms Period (Total 50,000 Points)
Metrics
| Memory | CPU | Network Bandwidth |
|---|---|---|
| 115.0 Mib | 5.71% | rx: 1.32 MB/s tx: 1.19 MB/s |
Resource Monitor Screenshots
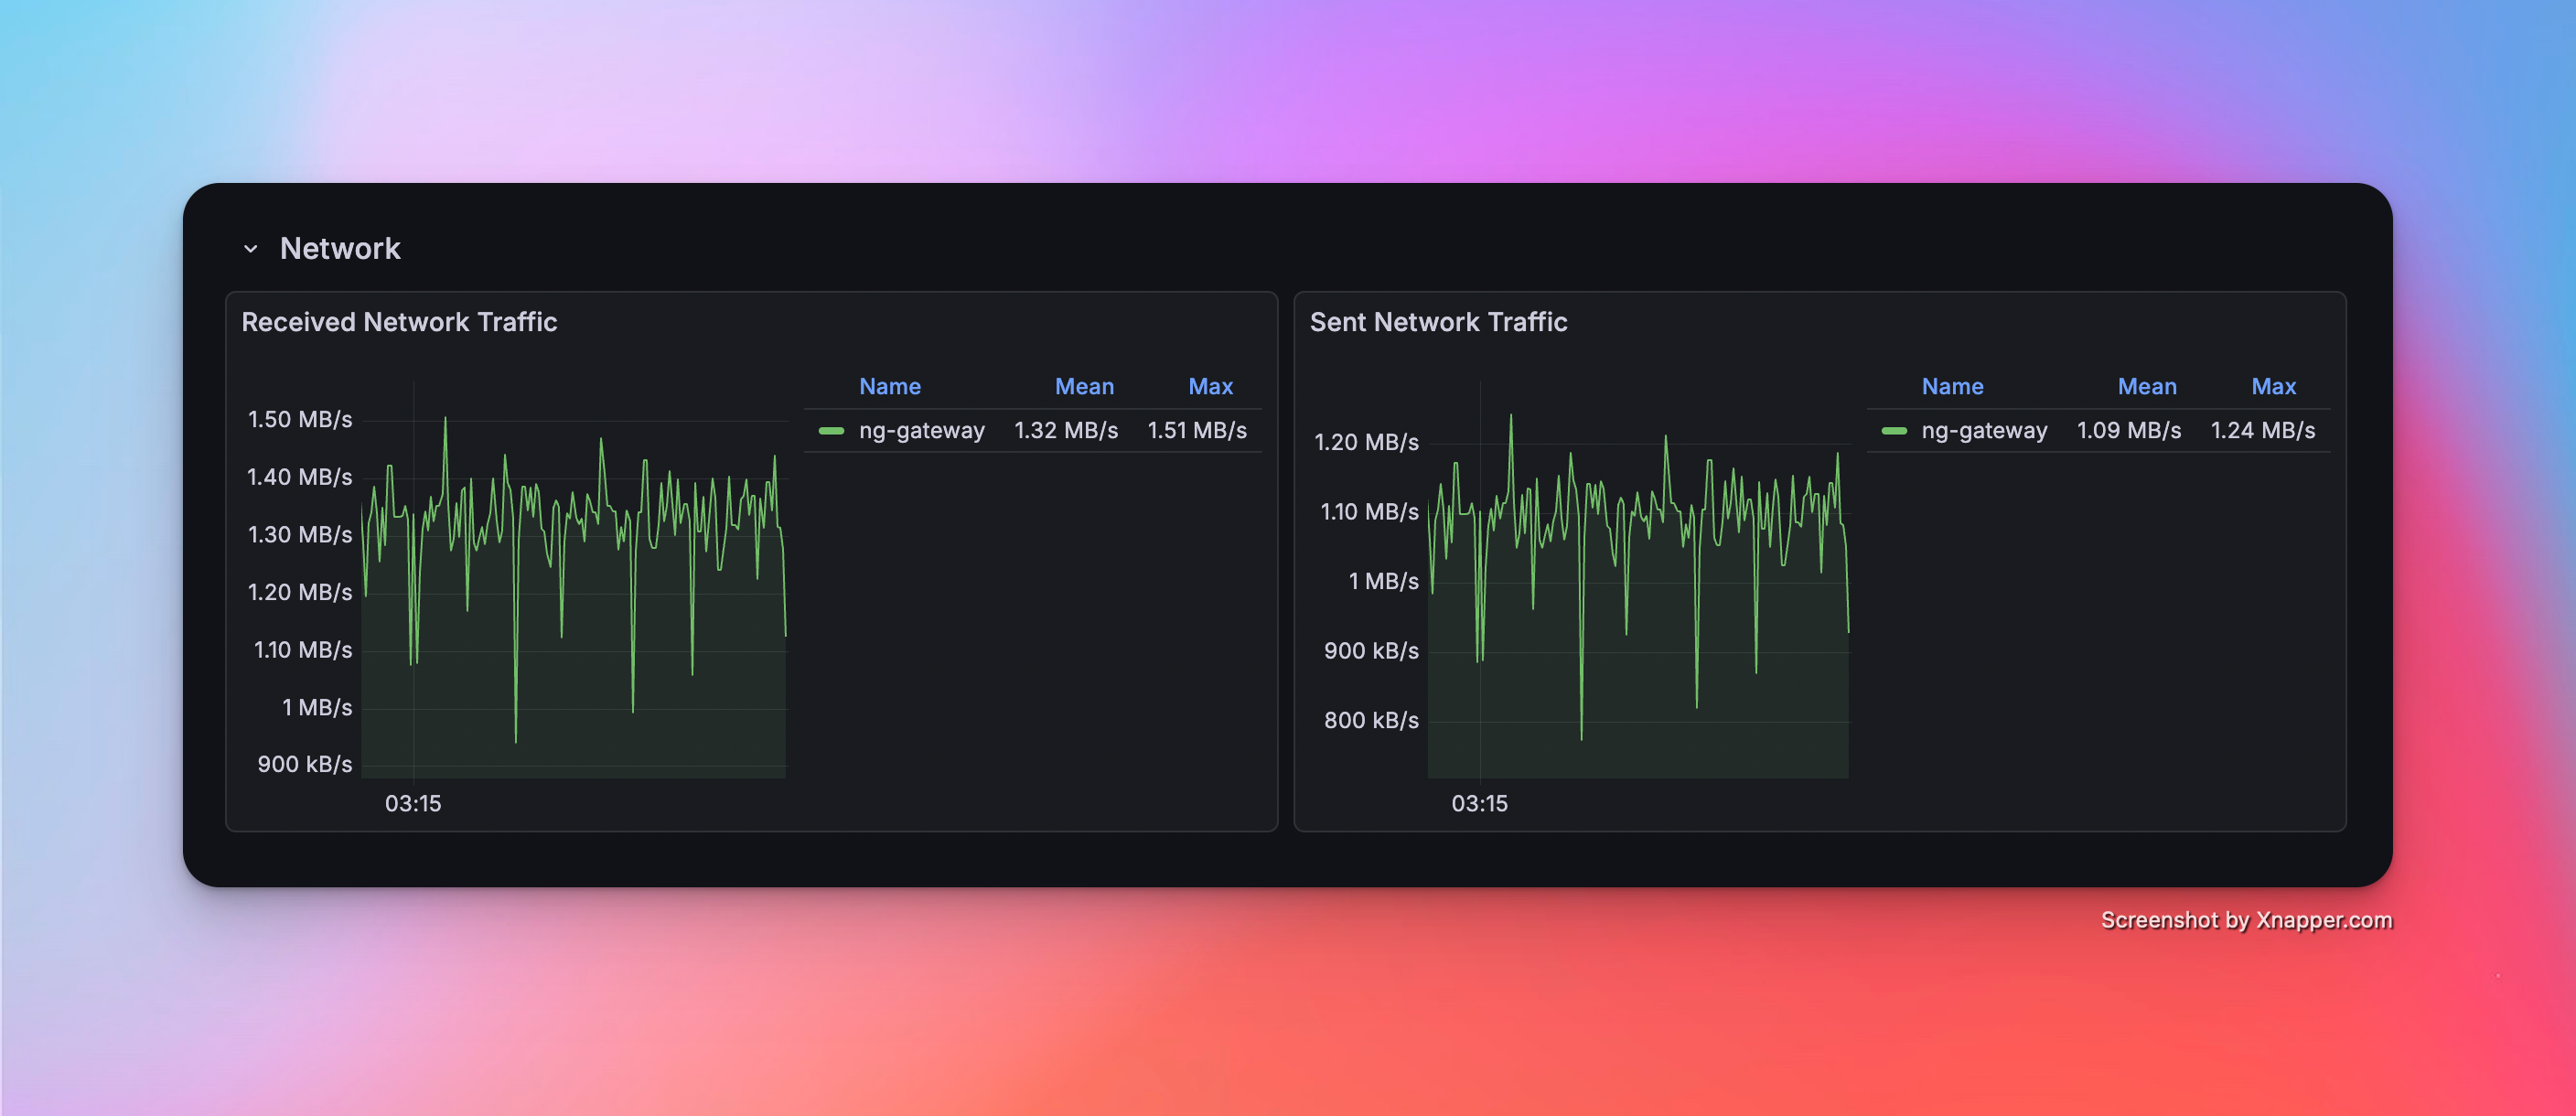
Scenario 3: Large Scale Collection
- Config: 10 Channels · 10 Devices · 1,000 Points/Device · 1000 ms Period (Total 100,000 Points)
Metrics
| Memory | CPU | Network Bandwidth |
|---|---|---|
| 165.0 MiB | 8.28% | rx: 2.38 MB/s tx: 1.95 MB/s |
Resource Monitor Screenshots


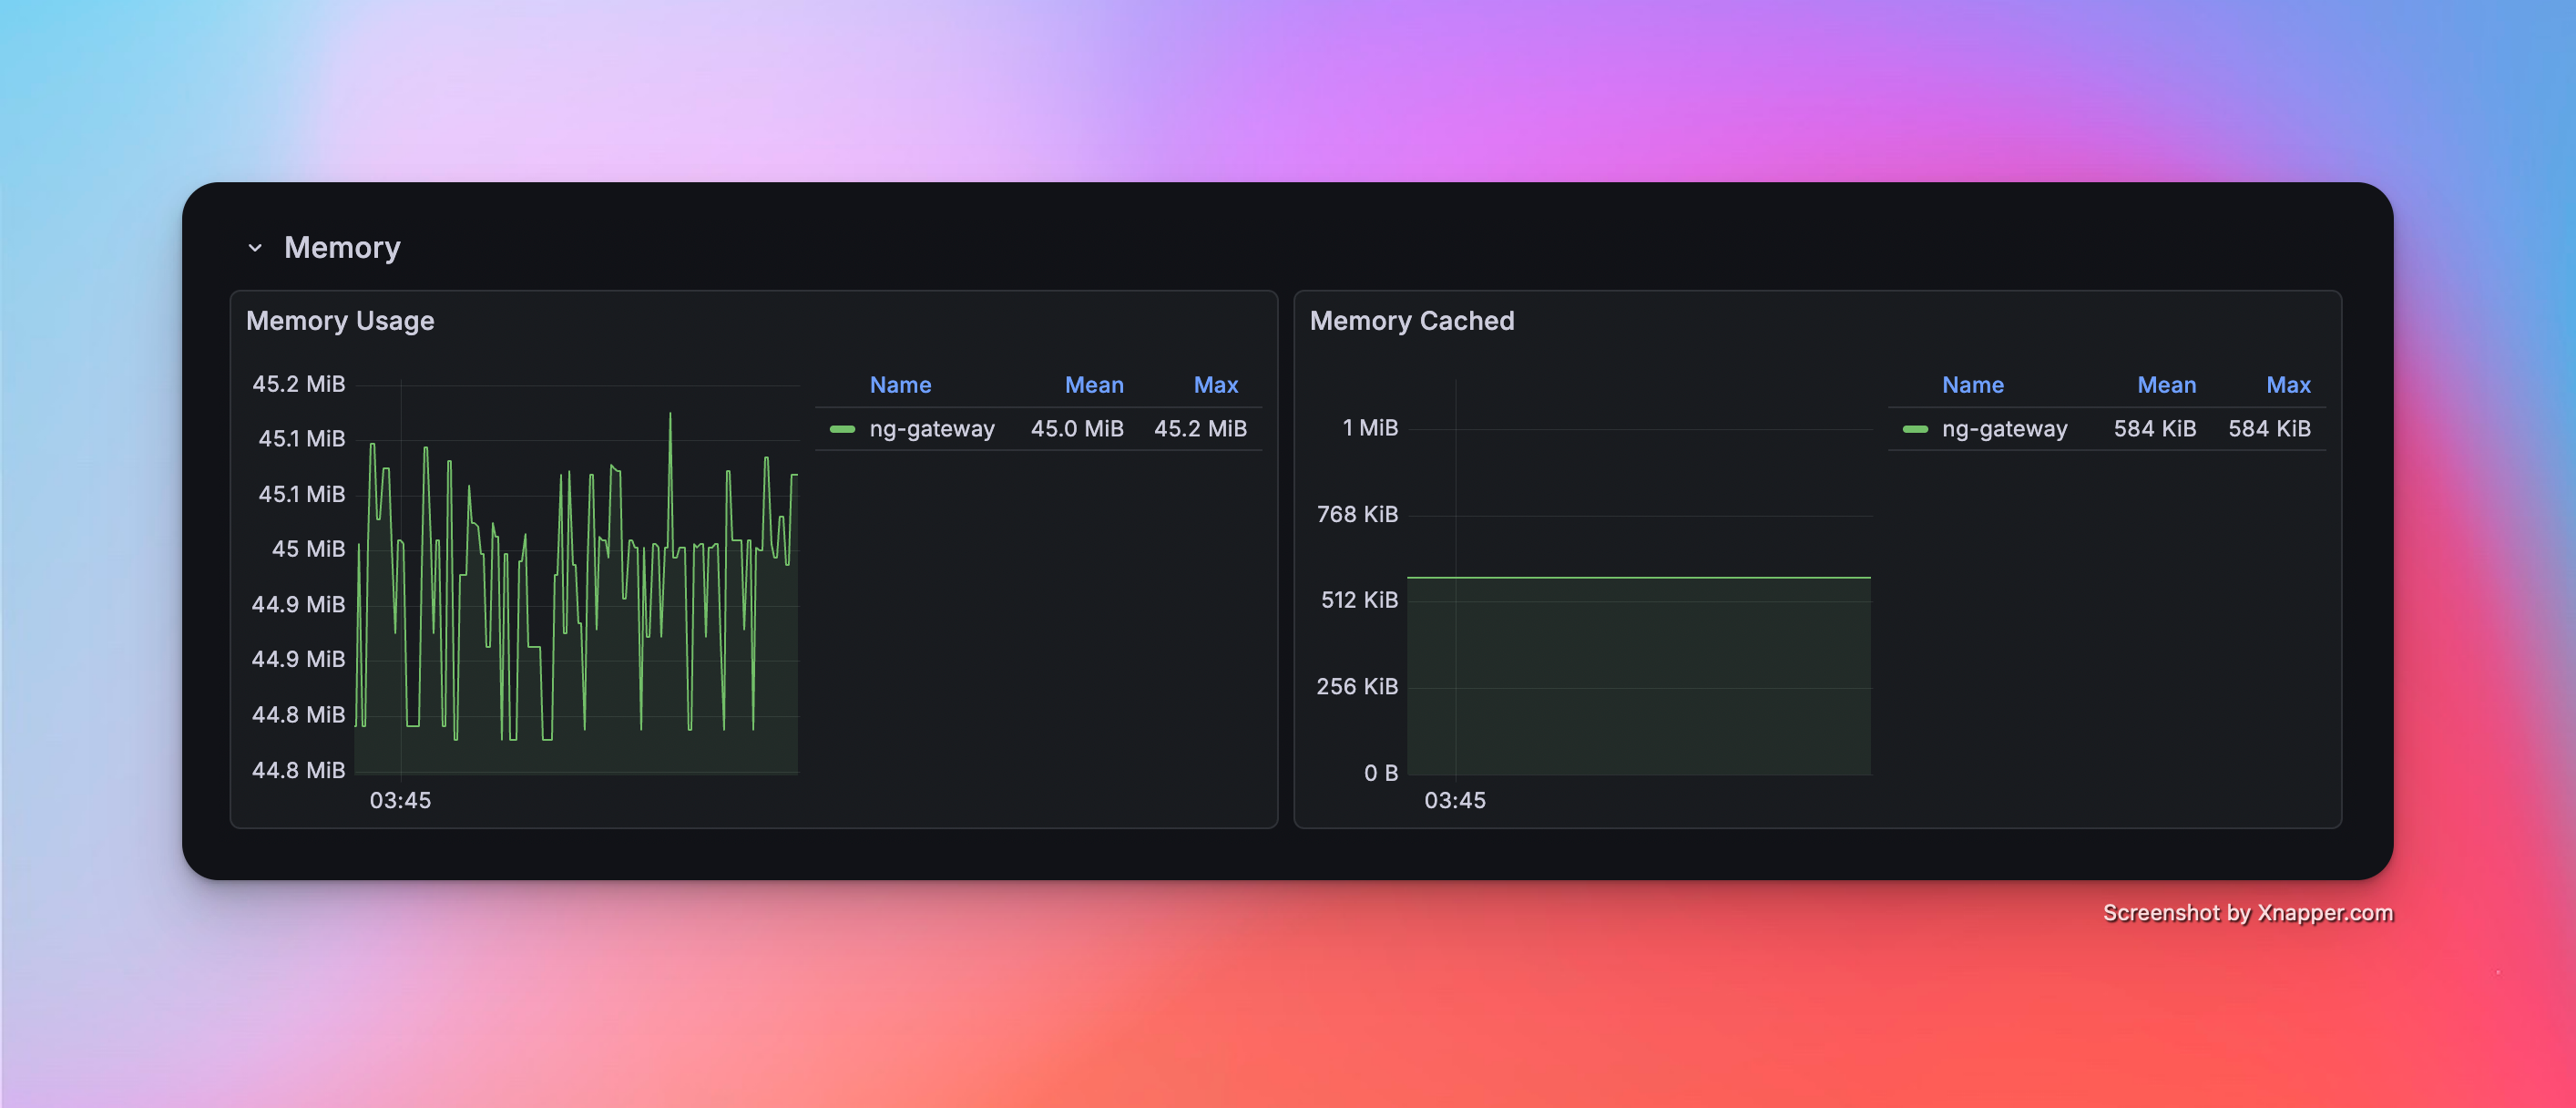
Scenario 4: High Frequency (Single Channel)
- Config: 1 Channel · 1 Device · 1,000 Points/Device · 100 ms Period (Total 1,000 Points)
Metrics
| Memory | CPU | Network Bandwidth |
|---|---|---|
| 45.0 MiB | 3.50% | rx: 216.0 kB/s tx: 178.0 kB/s |
Resource Monitor Screenshots


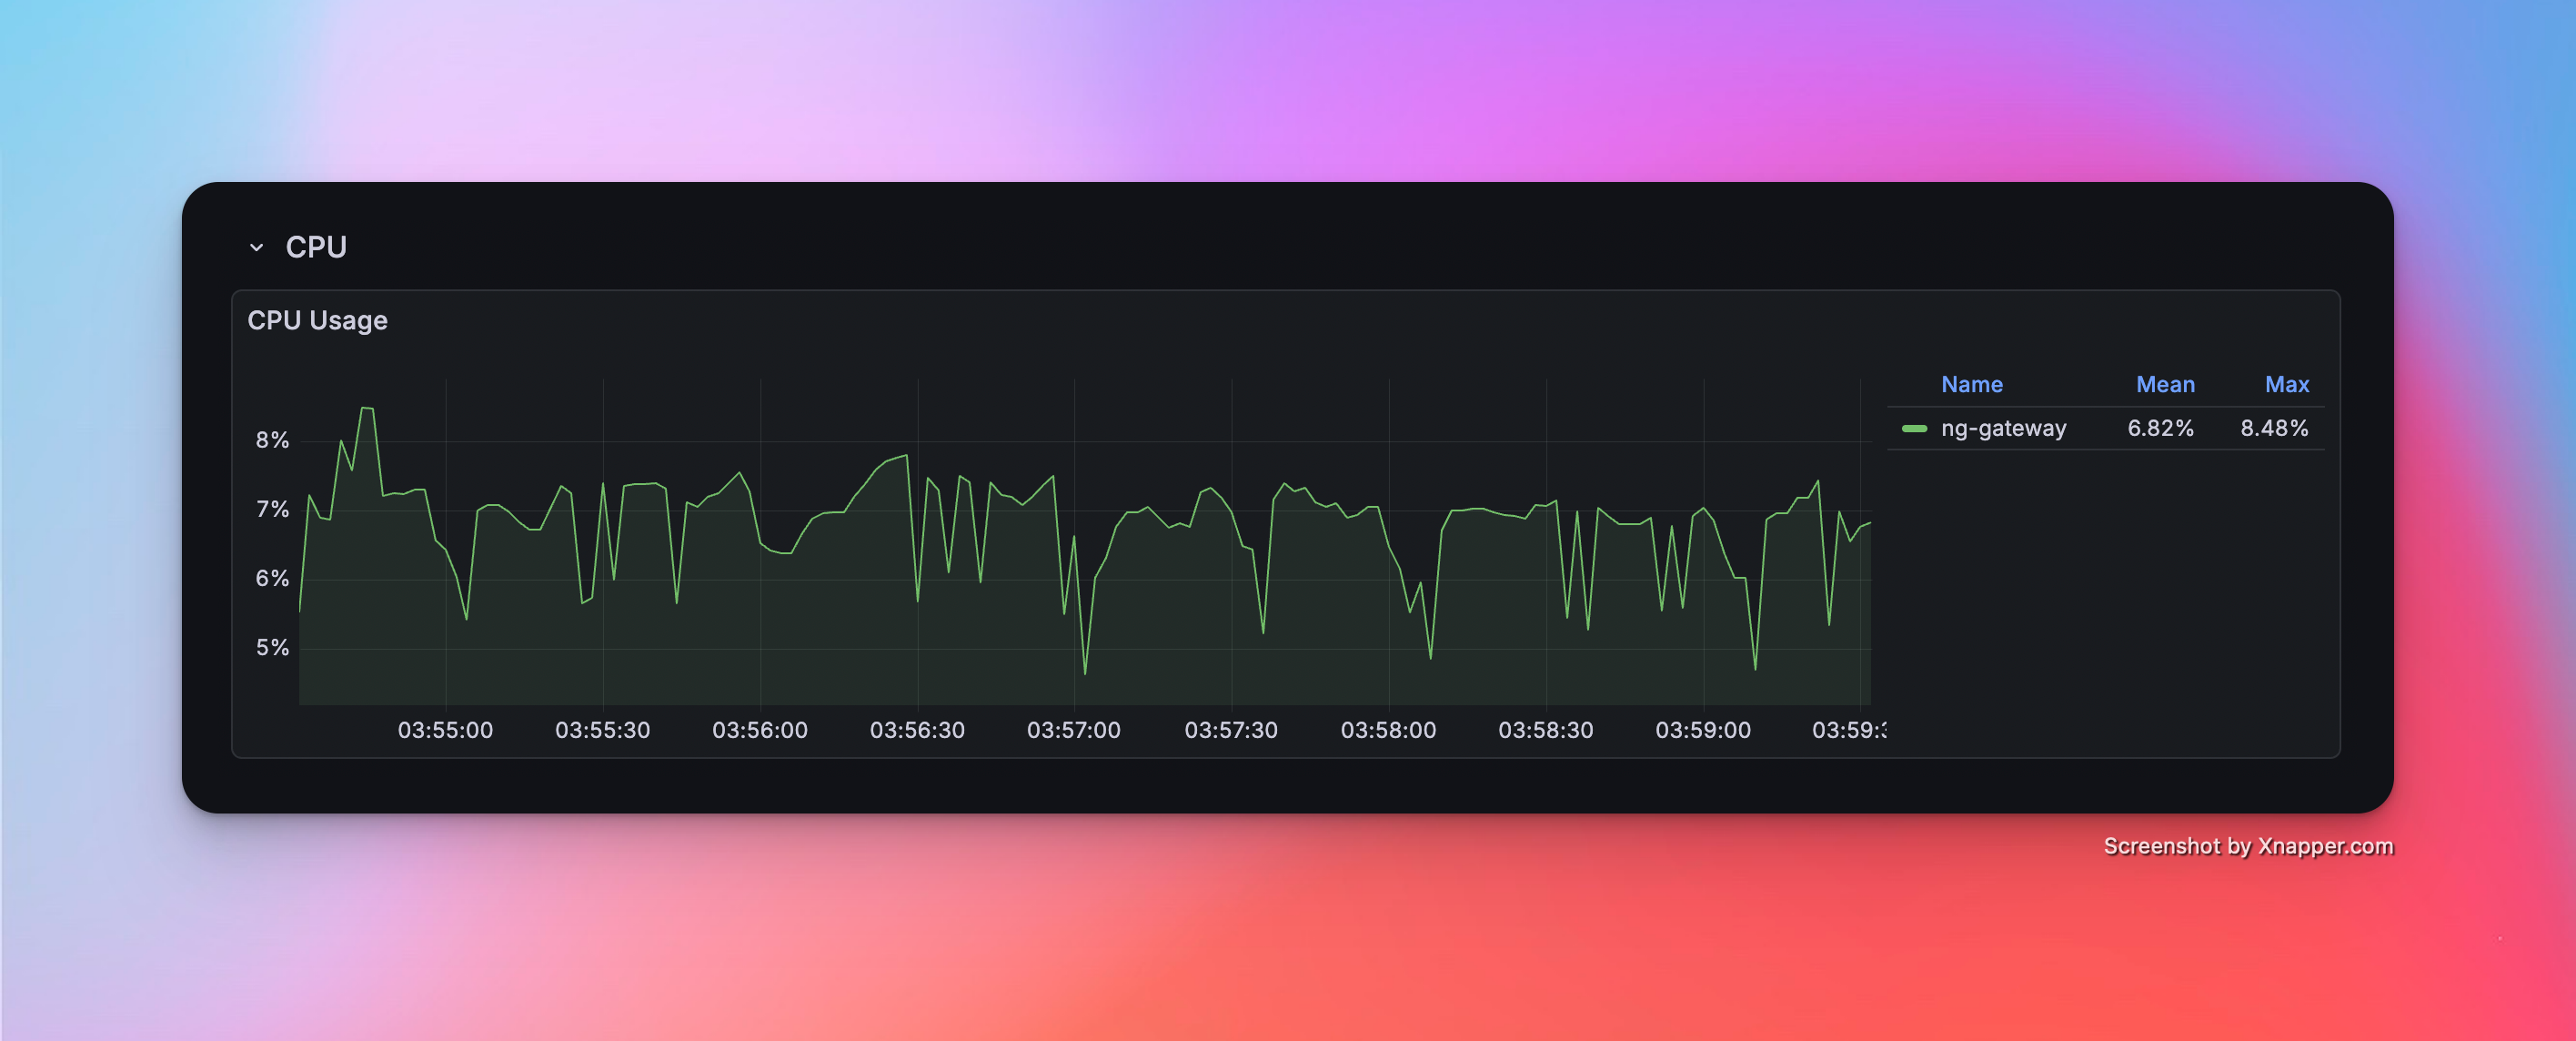
Scenario 5: High Frequency (Multi Channel)
- Config: 5 Channels · 1 Device · 1,000 Points/Device · 100 ms Period (Total 5,000 Points)
Metrics
| Memory | CPU | Network Bandwidth |
|---|---|---|
| 51.6 MiB | 6.82% | rx: 1.08 MB/s tx: 887.0 kB/s |
Resource Monitor Screenshots

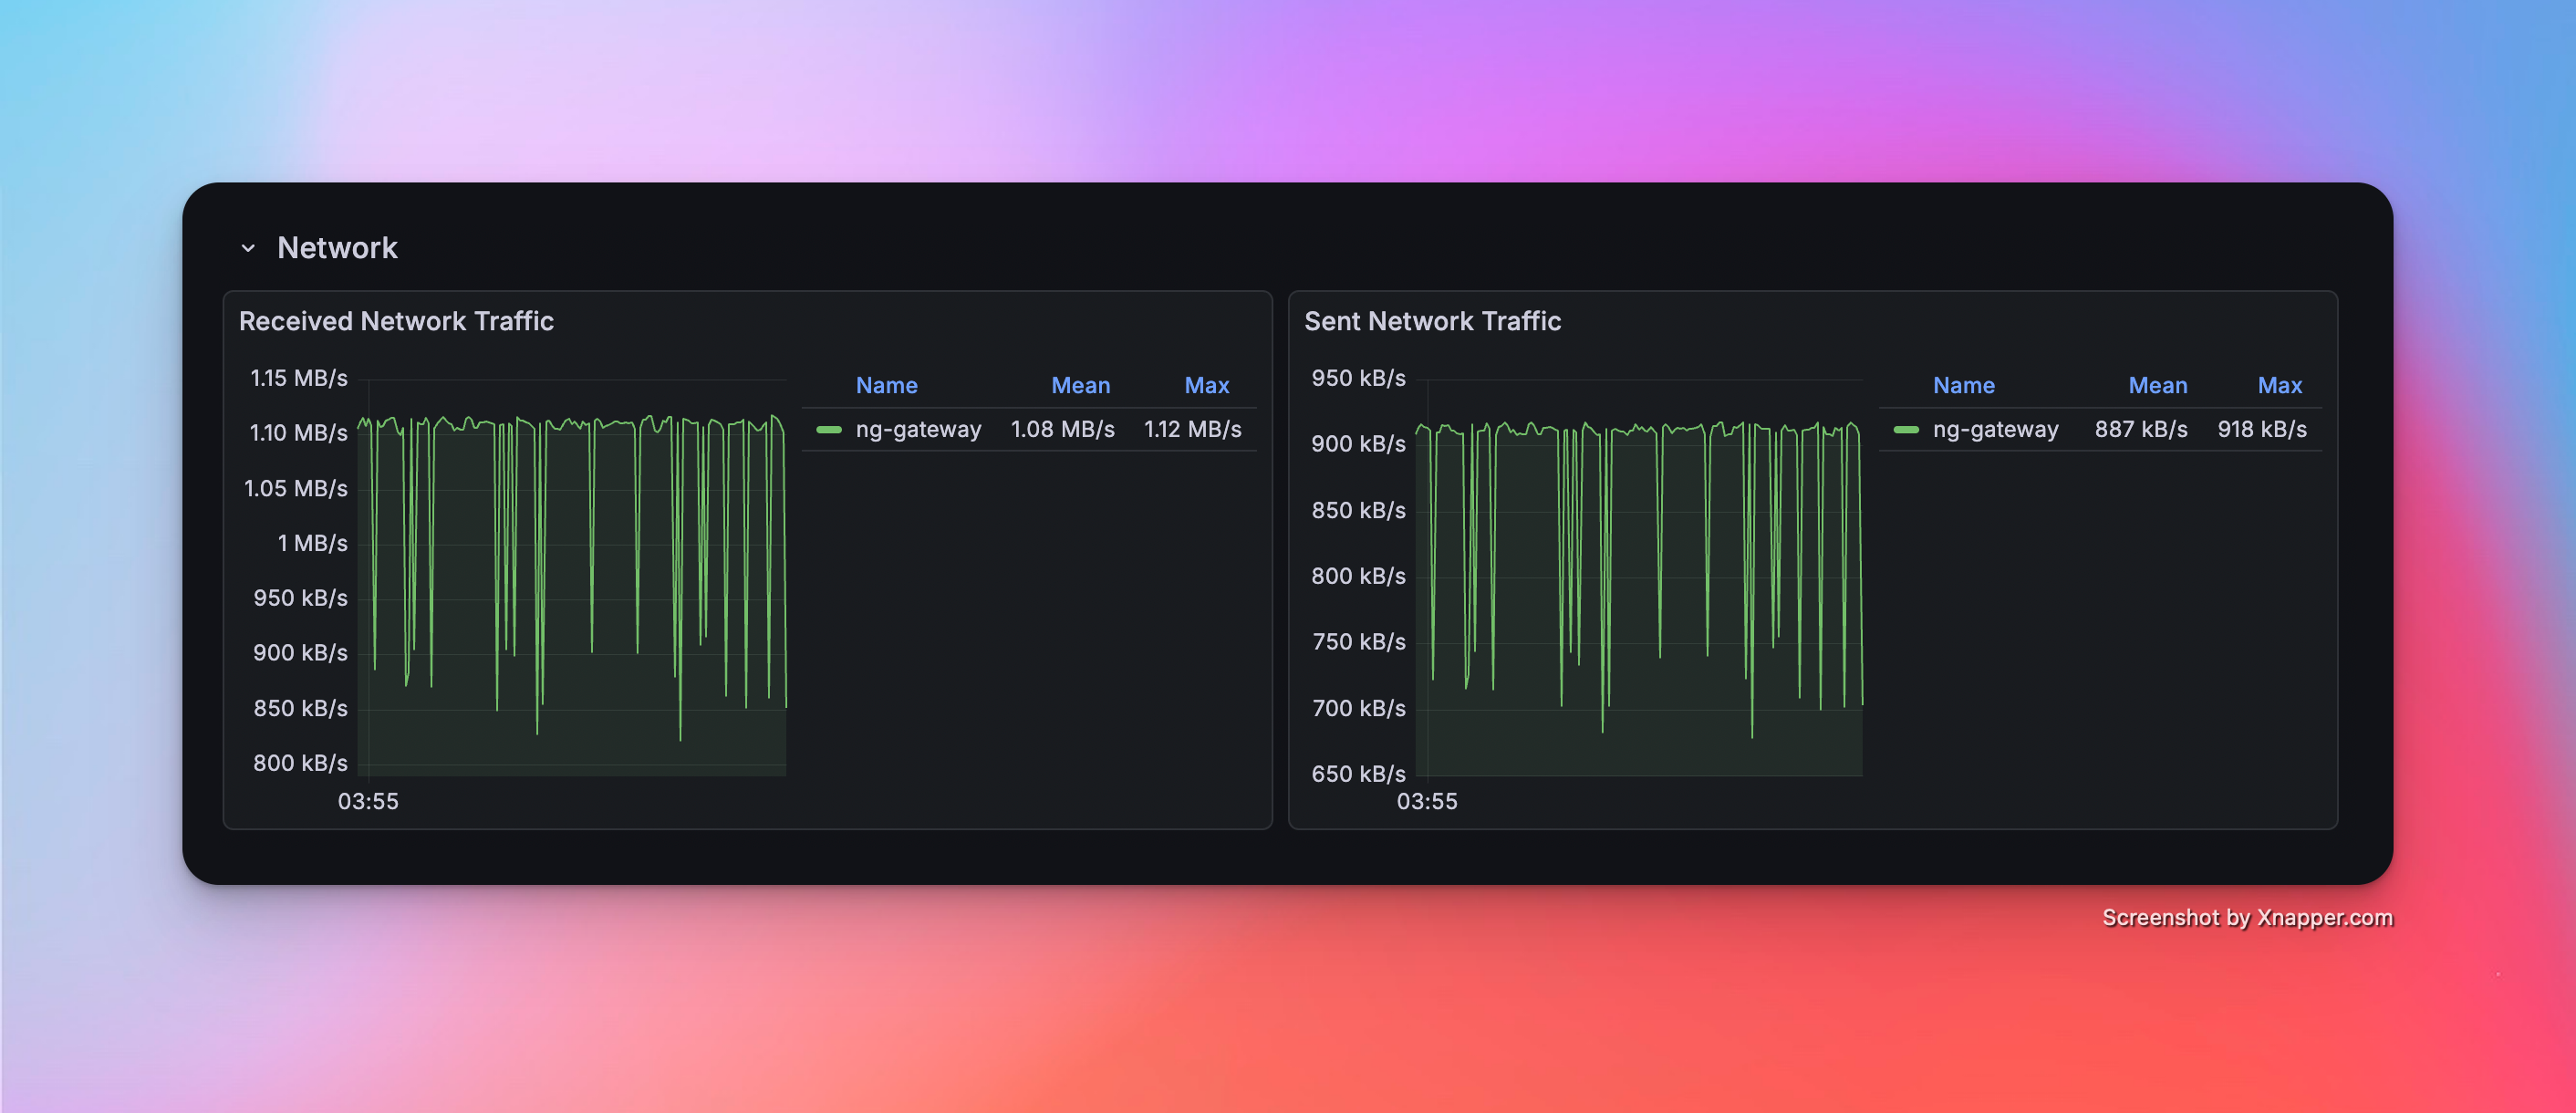
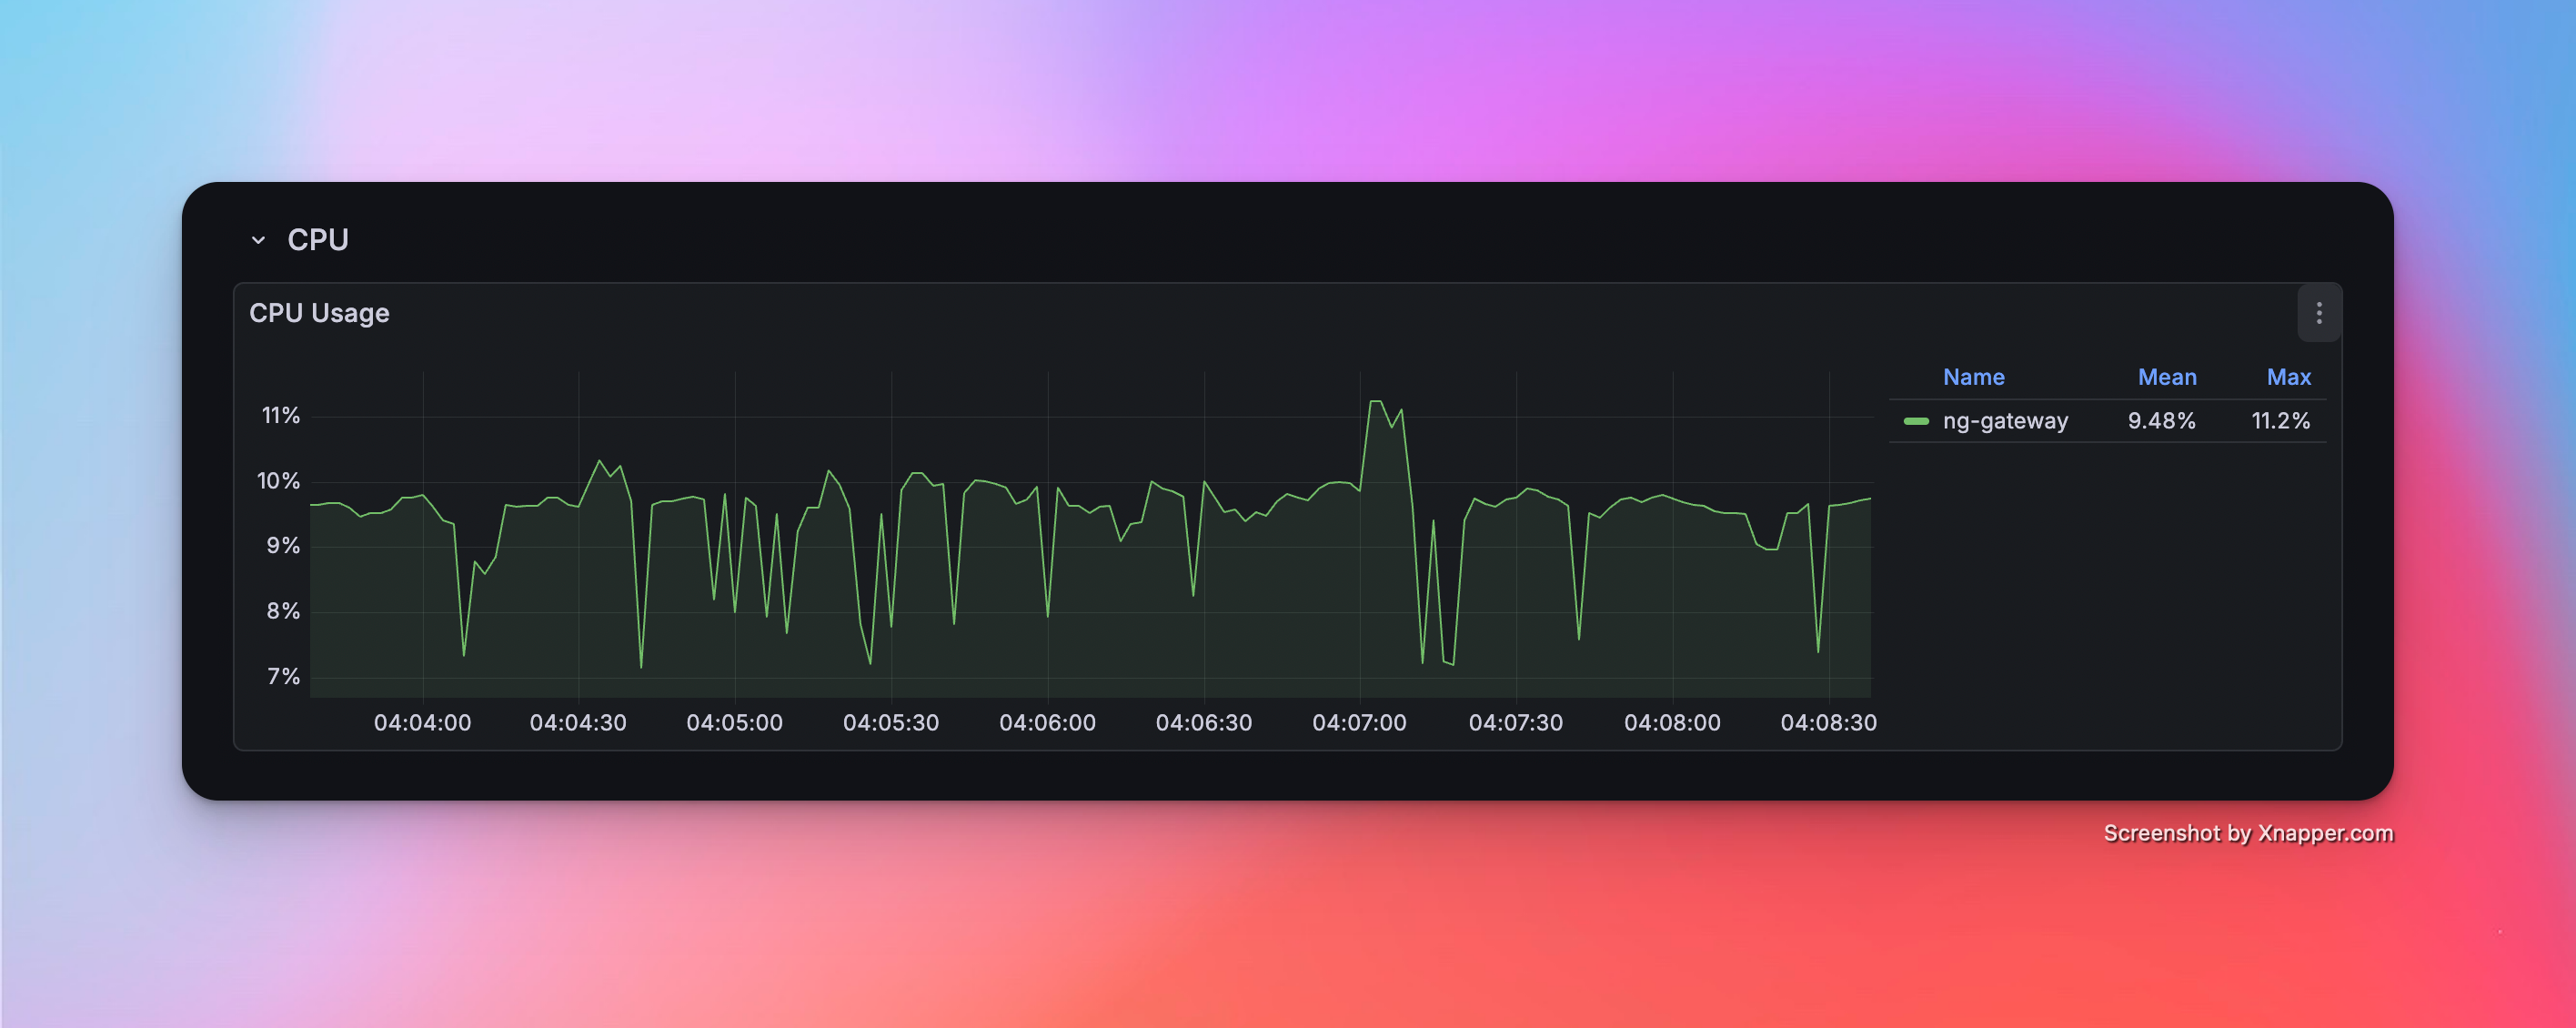
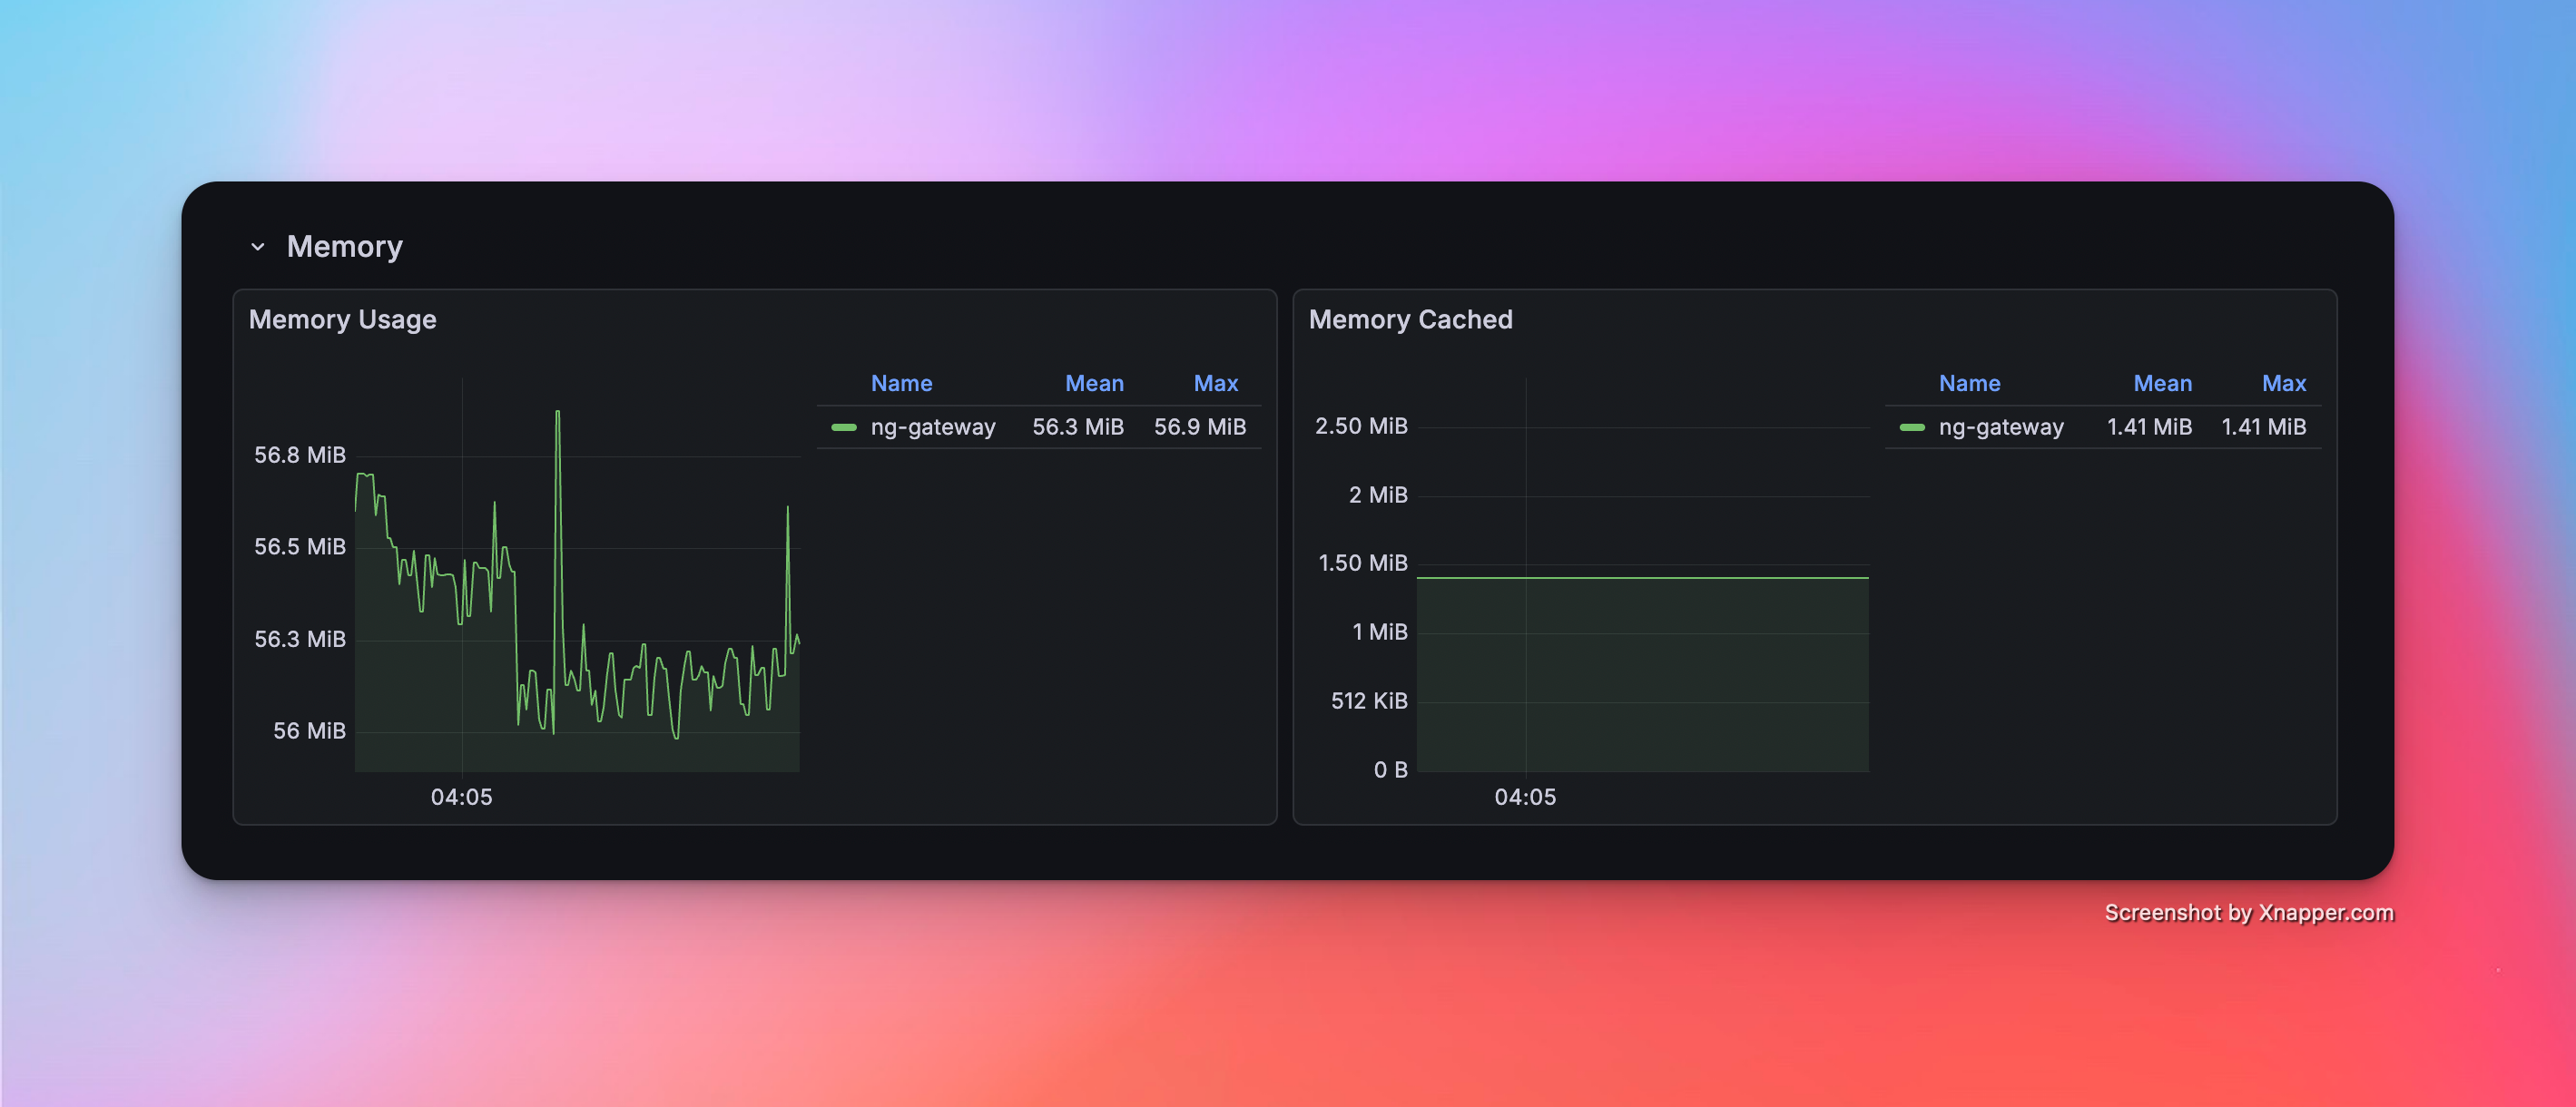
Scenario 6: High Frequency (Large Scale)
- Config: 10 Channels · 1 Device · 1,000 Points/Device · 100 ms Period (Total 10,000 Points)
Metrics
| Memory | CPU | Network Bandwidth |
|---|---|---|
| 56.3 MiB | 9.48% | rx: 2.16 MB/s tx: 1.78 MB/s |
Resource Monitor Screenshots

Scenario 7: Mixed Workload (Collection + Downlink)
- Config: 10 Channels · 10 Devices · 1,000 Points/Device · 1000 ms Period (Total 100,000 Points) + Random Command Dispatching
Metrics (Collection)
| Memory | CPU | Network Bandwidth |
|---|---|---|
| 165.0 MiB | 8.28% | rx: 2.38 MB/s tx: 1.95 MB/s |
Metrics (Downlink)
| Success/Fail | Min Latency | Max Latency | Avg Latency |
|---|---|---|---|
| 100 / 0 | 1,795 ms | 113.257 ms | 4.194 ms |
Resource Monitor Screenshots