Modbus Benchmark
This document records the performance benchmark process and results of NG Gateway for the Modbus TCP protocol. The tests run the gateway in a resource-constrained Docker container (1 CPU / 1 GB memory), using an external Modbus slave simulator to provide real protocol interaction workloads, and leveraging a Prometheus + Grafana + cAdvisor monitoring stack to collect container-level resource metrics in real time, systematically evaluating the gateway's resource consumption and operational stability under different collection scales and frequencies.
The tests cover the following dimensions:
- Collection Scale Gradient: From a single channel with 10 devices (10,000 points) scaling up to 10 channels with 100 devices (100,000 points)
- Collection Frequency Comparison: Standard cycle (1000 ms) vs. high-frequency collection (100 ms)
- Mixed Workload Stress Test: Large-scale data collection combined with concurrent random command dispatching
Test Environment
Hardware Platform
| Item | Specification |
|---|---|
| CPU | 4 Cores |
| Memory | 24 GB |
| OS | Debian GNU/Linux 12 |
Gateway Deployment
The gateway is deployed as a docker compose container with resource limits to simulate a constrained edge-side environment:
| Resource | Limit | Reservation |
|---|---|---|
| CPU | 1.0 Core | 0.5 Core |
| Memory | 1000 MiB | 256 MiB |
TIP
Resource constraints are configured via Docker Compose deploy.resources.limits, consistent with Kubernetes Pod resource quota semantics.
docker-compose.yaml
services:
  gateway:
    image: ${GATEWAY_IMAGE:-shiyuecamus/ng-gateway}:${GATEWAY_TAG:-latest}
    container_name: ng-gateway
    restart: unless-stopped
    ports:
      - "${GATEWAY_HTTP_PORT:-8978}:5678"
      - "${GATEWAY_WS_PORT:-8979}:5679"
    volumes:
      - gateway-data:/app/data
      - gateway-drivers:/app/drivers/custom
      - gateway-plugins:/app/plugins/custom
    deploy:
      resources:
        limits:
          cpus: "${BENCH_CPU_LIMIT:-1.0}"
          memory: "${BENCH_MEM_LIMIT:-1000M}"
        reservations:
          cpus: "${BENCH_CPU_RESERVE:-0.5}"
          memory: "${BENCH_MEM_RESERVE:-256M}"

  cadvisor:
    image: gcr.io/cadvisor/cadvisor:v0.51.0
    container_name: ng-cadvisor
    restart: unless-stopped
    ports:
      - "8080:8080"
    command:
      - --docker_only=true
      - --housekeeping_interval=2s
      - --store_container_labels=true
    volumes:
      - /:/rootfs:ro
      - /var/run:/var/run:ro
      - /var/run/docker.sock:/var/run/docker.sock:rw
      - /sys:/sys:ro
      - /sys/fs/cgroup:/sys/fs/cgroup:ro
      - /var/lib/docker/:/var/lib/docker:ro
      - /dev/disk/:/dev/disk:ro
    privileged: true
    devices:
      - /dev/kmsg:/dev/kmsg

  prometheus:
    image: prom/prometheus:latest
    container_name: ng-prometheus
    restart: unless-stopped
    ports:
      - "9090:9090"
    volumes:
      - ./prometheus/prometheus.yml:/etc/prometheus/prometheus.yml:ro
      - ng-prometheus-data:/prometheus
    command:
      - --config.file=/etc/prometheus/prometheus.yml
      - --storage.tsdb.path=/prometheus
      - --web.enable-lifecycle
    depends_on:
      - cadvisor
      - gateway

  grafana:
    image: grafana/grafana:latest
    container_name: ng-grafana
    restart: unless-stopped
    ports:
      - "3000:3000"
    environment:
      GF_SECURITY_ADMIN_USER: admin
      GF_SECURITY_ADMIN_PASSWORD: admin
      GF_USERS_ALLOW_SIGN_UP: "false"
      GF_PATHS_PROVISIONING: /etc/grafana/provisioning
    volumes:
      - ./grafana/provisioning:/etc/grafana/provisioning:ro
      - ./grafana/dashboards:/var/lib/grafana/dashboards:ro
      - ng-grafana-data:/var/lib/grafana
    depends_on:
      - prometheus

volumes:
  ng-prometheus-data:
  ng-grafana-data:
  gateway-data:
  gateway-drivers:
  gateway-plugins:
Test Tools
Modbus Slave Simulator
Modbus Slave (by Witte Software) is used as the Modbus TCP slave simulator. Modbus Slave is a widely adopted commercial-grade simulation tool in the industrial automation field, supporting Modbus TCP / RTU / ASCII protocols. It can simultaneously simulate multiple independent slave instances and provides flexible register type configuration, auto-increment, and randomized data simulation capabilities, making it suitable for driver development debugging and performance benchmarking.
Simulation Topology:
| Item | Configuration |
|---|---|
| Independent TCP Connections | 10 (listening ports 500 ~ 509) |
| Slaves per Connection | 10 (Slave ID 1 ~ 10) |
| Total Simulated Slaves | 100 |
Mapping Relationship
- Each TCP port maps to a Channel in
ng-gateway— an independent Modbus TCP connection - Each Slave ID maps to a Device within the channel — polled via function codes at different slave addresses
- Test scenarios connect to a subset or all ports as needed to build collection workloads ranging from 10,000 to 100,000 points
Performance Monitoring Stack
Resource metrics during testing are collected using the cAdvisor + Prometheus + Grafana stack, all orchestrated alongside the gateway container via the same docker compose file:
| Component | Version | Role |
|---|---|---|
| cAdvisor | v0.51.0 | Collects container-level resource metrics: CPU usage, memory (RSS / Cache), network bytes sent/received |
| Prometheus | latest | Scrapes cAdvisor /metrics endpoint every 2s, persists time-series data |
| Grafana | latest | Visualization dashboards with pre-configured cAdvisor Docker container monitoring |
Core Metrics Collected:
| Metric | Prometheus Metric | Description |
|---|---|---|
| CPU Usage | container_cpu_usage_seconds_total | CPU usage percentage per container |
| Memory Usage | container_memory_rss | Resident Set Size |
| Network Receive | container_network_receive_bytes_total | Total bytes received (rate computed) |
| Network Transmit | container_network_transmit_bytes_total | Total bytes transmitted (rate computed) |
Quick Start:
cd deploy/compose/bench && docker compose up -d| Service | Access URL |
|---|---|
| Grafana | http://localhost:3000 (admin / admin) |
| Prometheus | http://localhost:9090 |
| cAdvisor | http://localhost:8080 |
| ng-gateway | http://localhost:8978 |
Summary
Data Collection Performance
| Scenario | Channels | Devices/Channel | Points/Device | Frequency | Total Points | Type | Memory | CPU | Network Bandwidth |
|---|---|---|---|---|---|---|---|---|---|
| 1 | 1 | 10 | 1,000 | 1000 ms | 10,000 | Float32 | 50.8 MiB | 2.62% | rx: 55.2 kB/s tx: 14 kB/s |
| 2 | 5 | 10 | 1,000 | 1000 ms | 50,000 | Float32 | 103 MiB | 4.41% | rx: 269.0 kB/s tx: 72.0 kB/s |
| 3 | 10 | 10 | 1,000 | 1000 ms | 100,000 | Float32 | 153 MiB | 7.03% | rx: 542.0 kB/s tx: 144.0 kB/s |
| 4 | 1 | 1 | 1,000 | 100 ms | 1,000 | Float32 | 44.8 MiB | 2.60% | rx: 47.8 kB/s tx: 13.5 kB/s |
| 5 | 5 | 1 | 1,000 | 100 ms | 5,000 | Float32 | 50.9 MiB | 4.61% | rx: 265.0 kB/s tx: 87.3 kB/s |
| 6 | 10 | 1 | 1,000 | 100 ms | 10,000 | Float32 | 55.2 MiB | 7.56% | rx: 530.0 kB/s tx: 173.0 kB/s |
| 7 | 10 | 10 | 1,000 | 1000 ms | 100,000 | Float32 | 153 MiB | 7.03% | rx: 542.0 kB/s tx: 144.0 kB/s |
Mixed Load Performance
| Scenario | Channels | Devices/Channel | Points/Device | Frequency | Total Points | Type | Downlink Method | Downlink Points | Iterations | Min Latency | Max Latency | Avg Latency |
|---|---|---|---|---|---|---|---|---|---|---|---|---|
| 7 | 10 | 10 | 1,000 | 1000 ms | 100,000 | Float32 | API | 100 | 100 | 14.572 ms | 536.517 ms | 75.600 ms |
Test Scenarios & Results
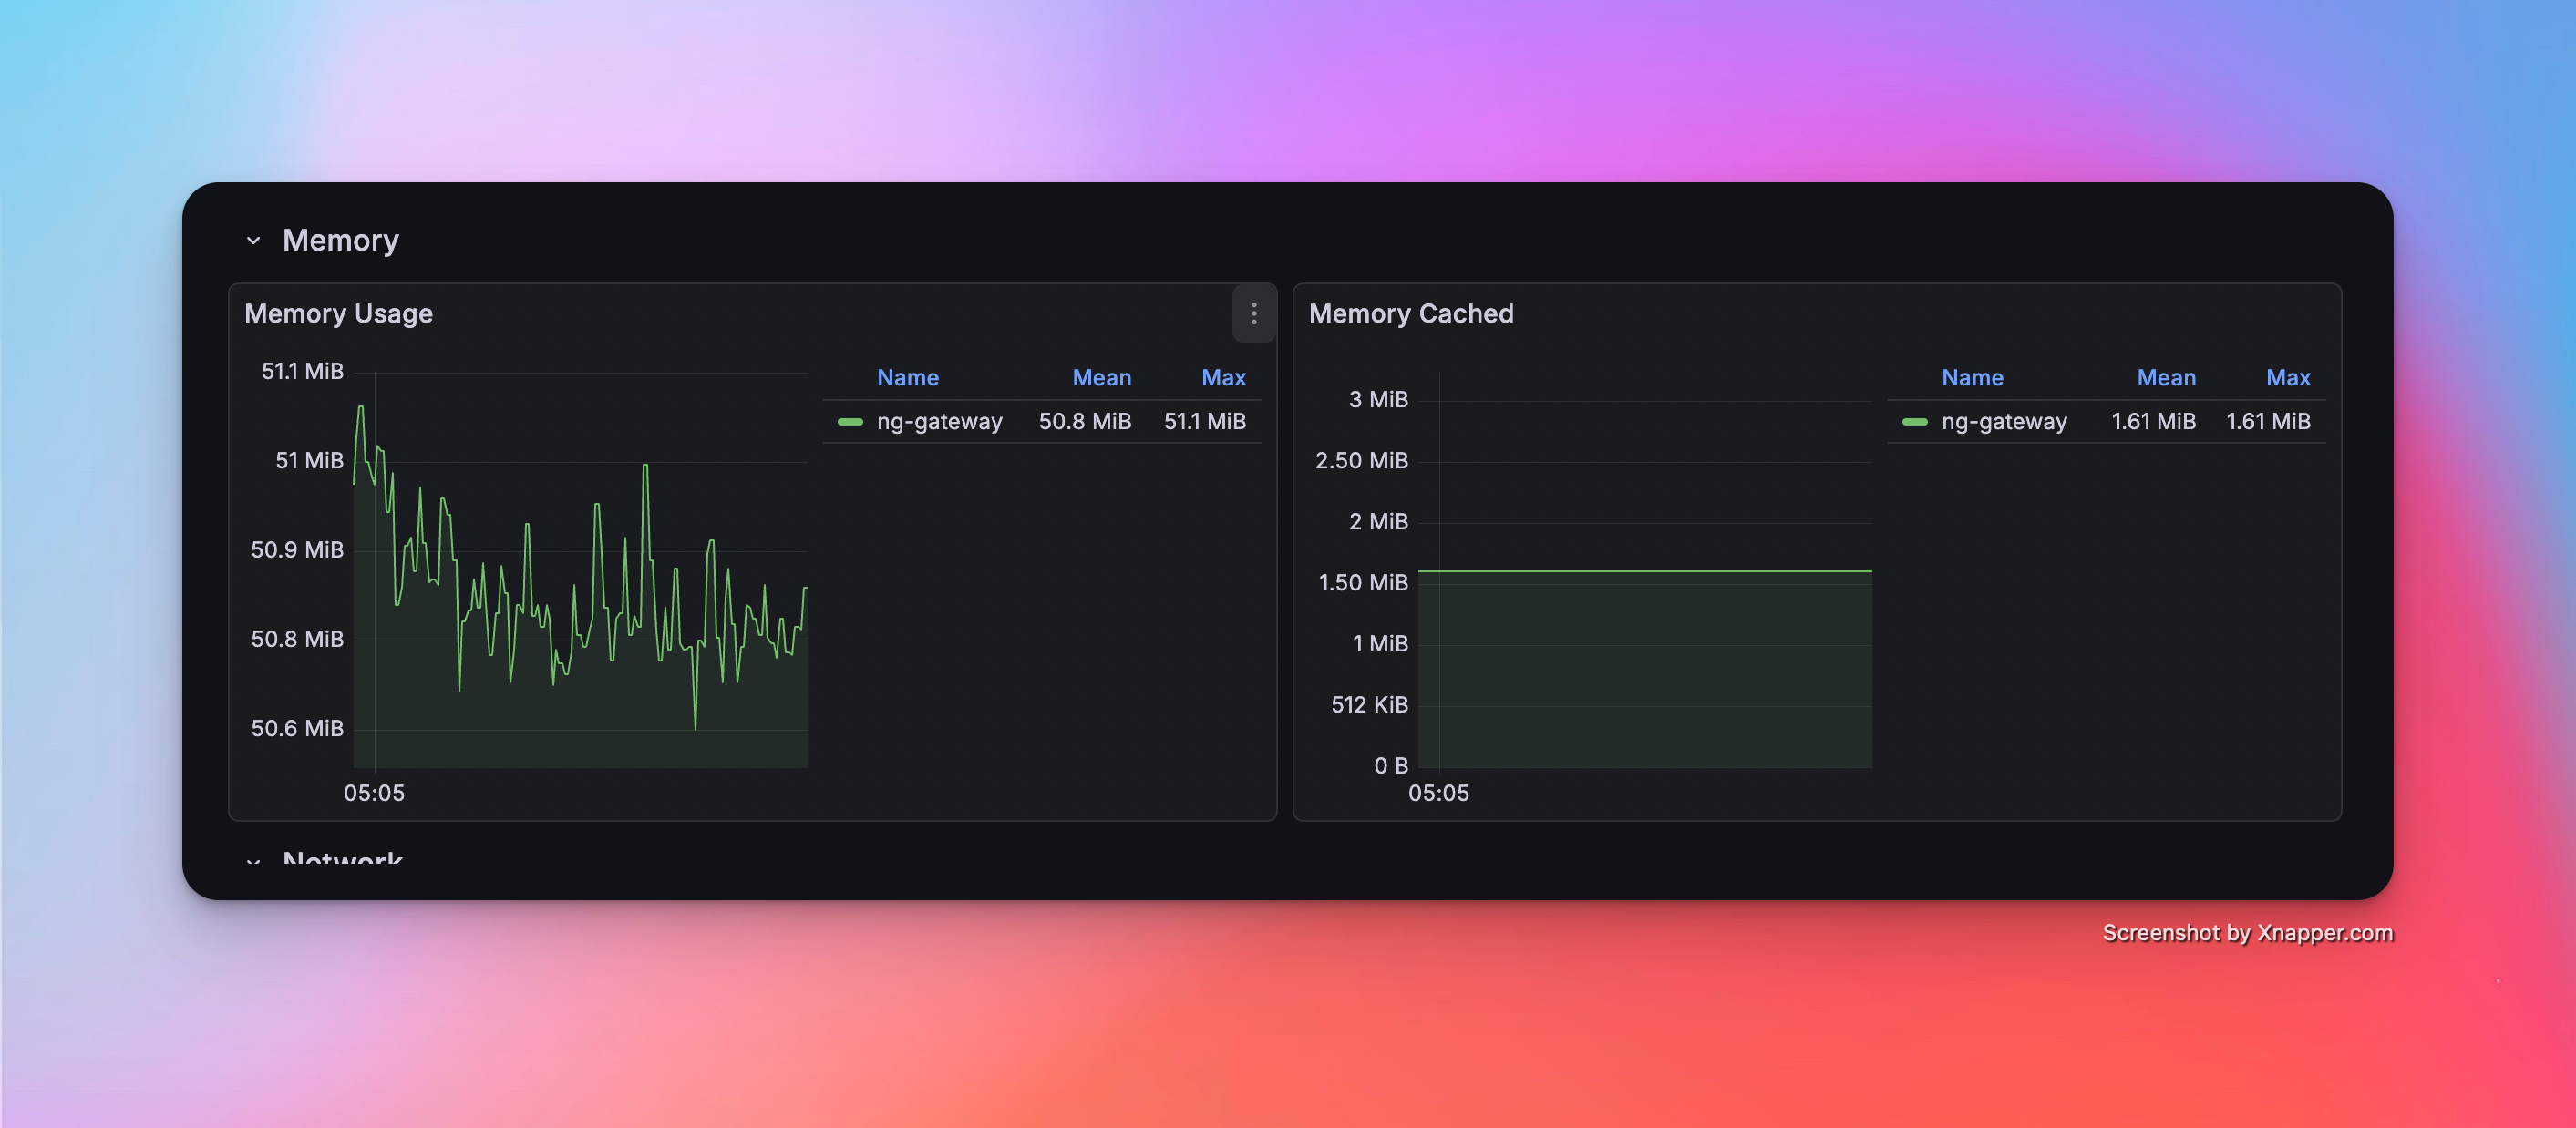
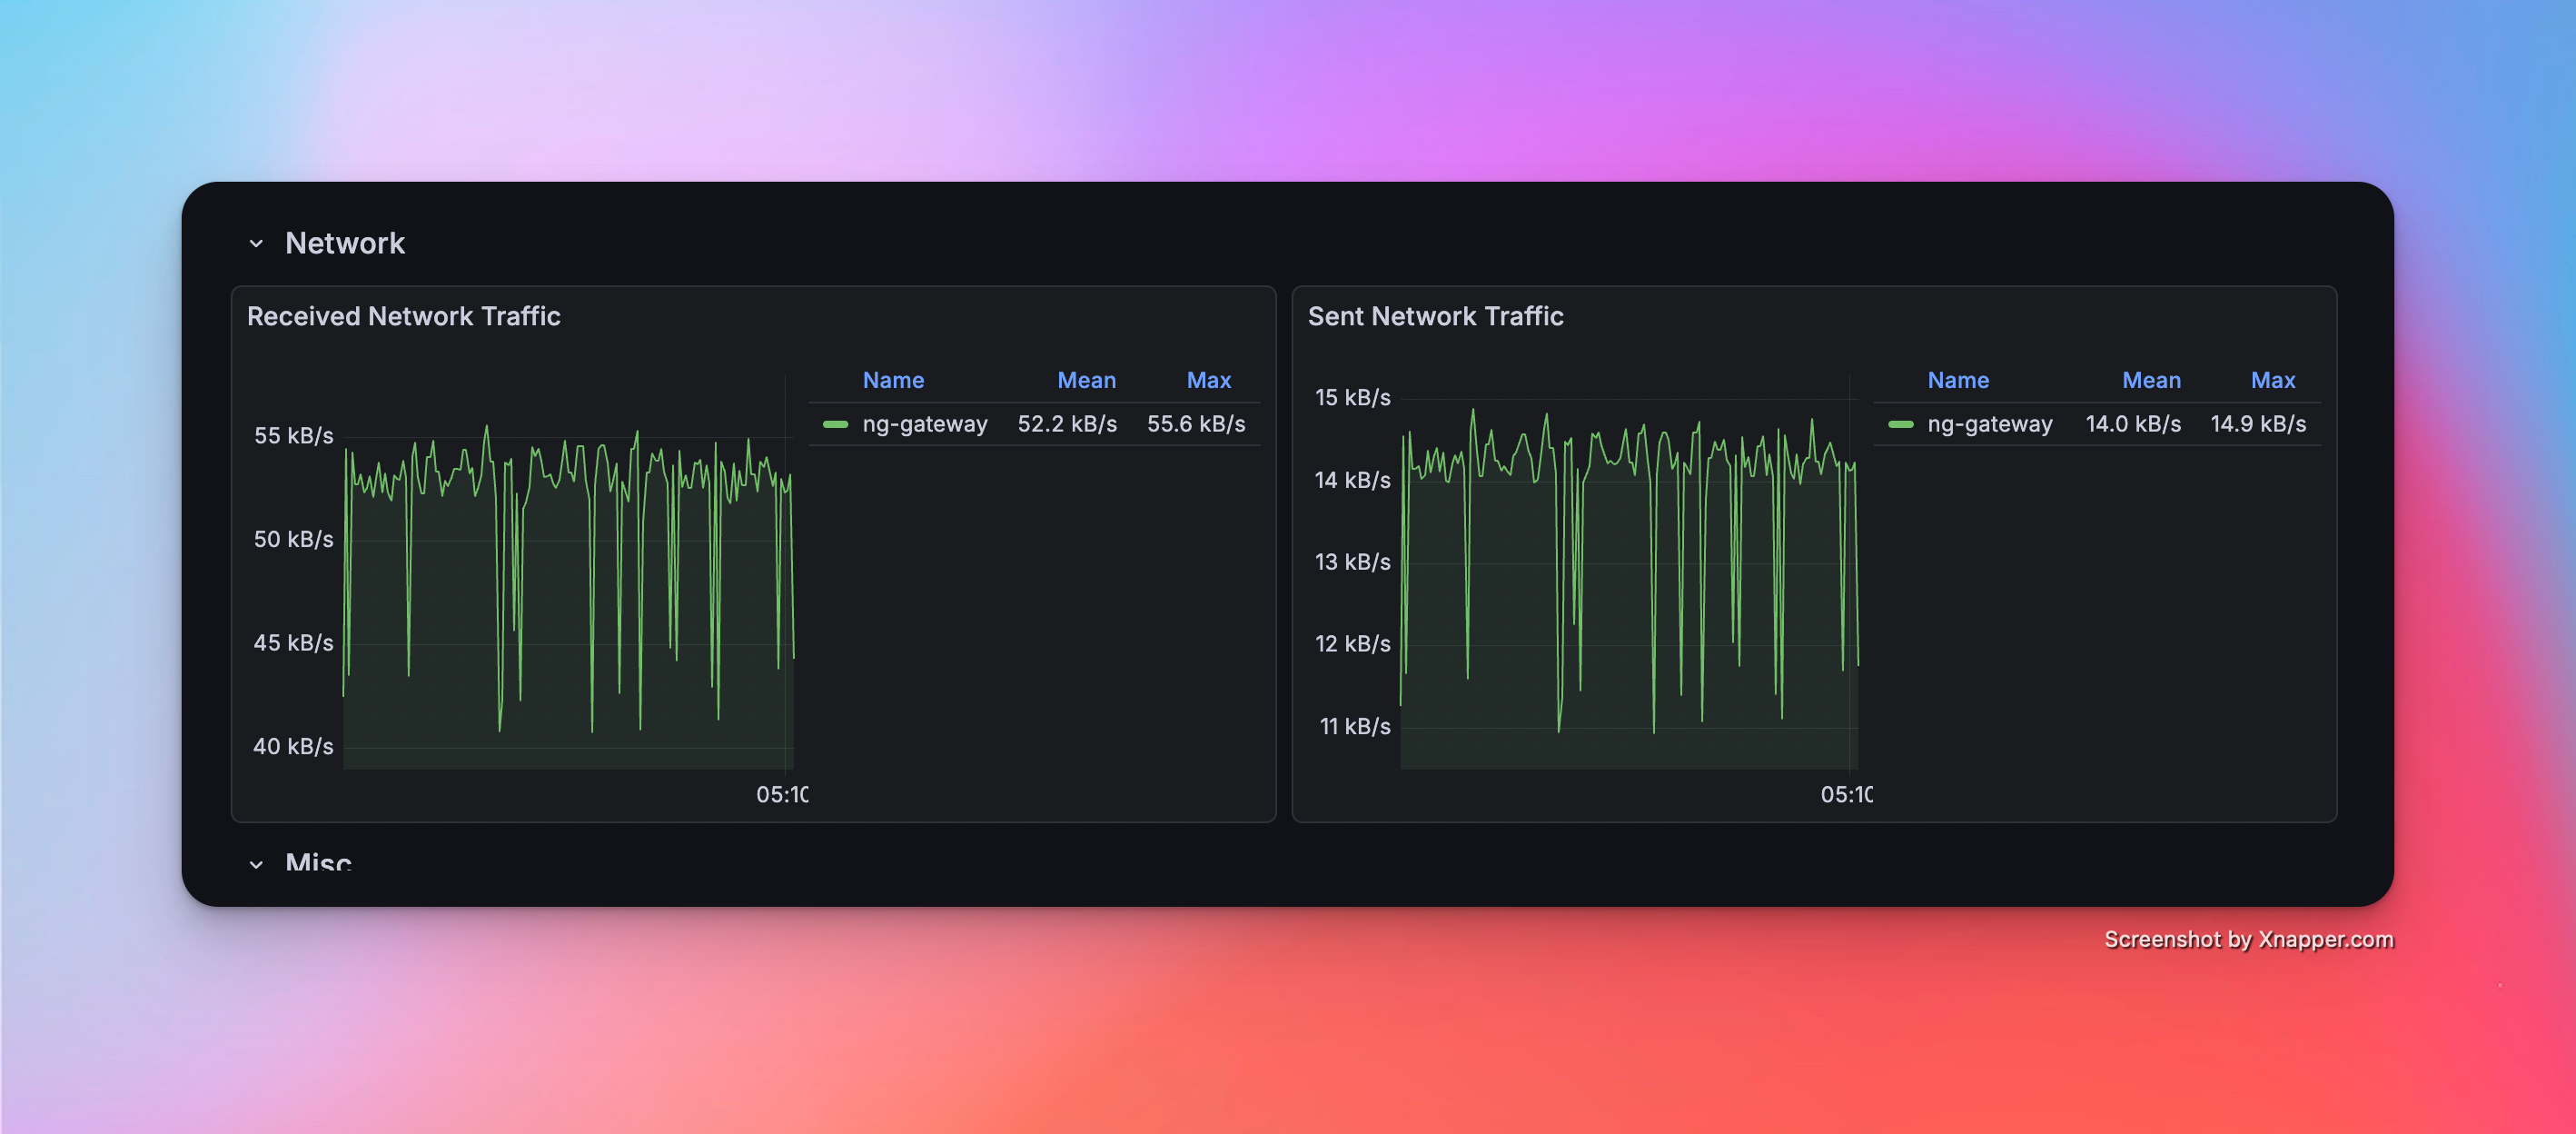
Scenario 1: Basic Collection
- Config: 1 Channel · 10 Devices · 1,000 Points/Device · 1000 ms Period (Total 10,000 Points)
Metrics
| Memory | CPU | Network Bandwidth |
|---|---|---|
| 50.8 MiB | 2.62% | rx: 55.2 kB/s tx: 14 kB/s |
Resource Monitor Screenshots

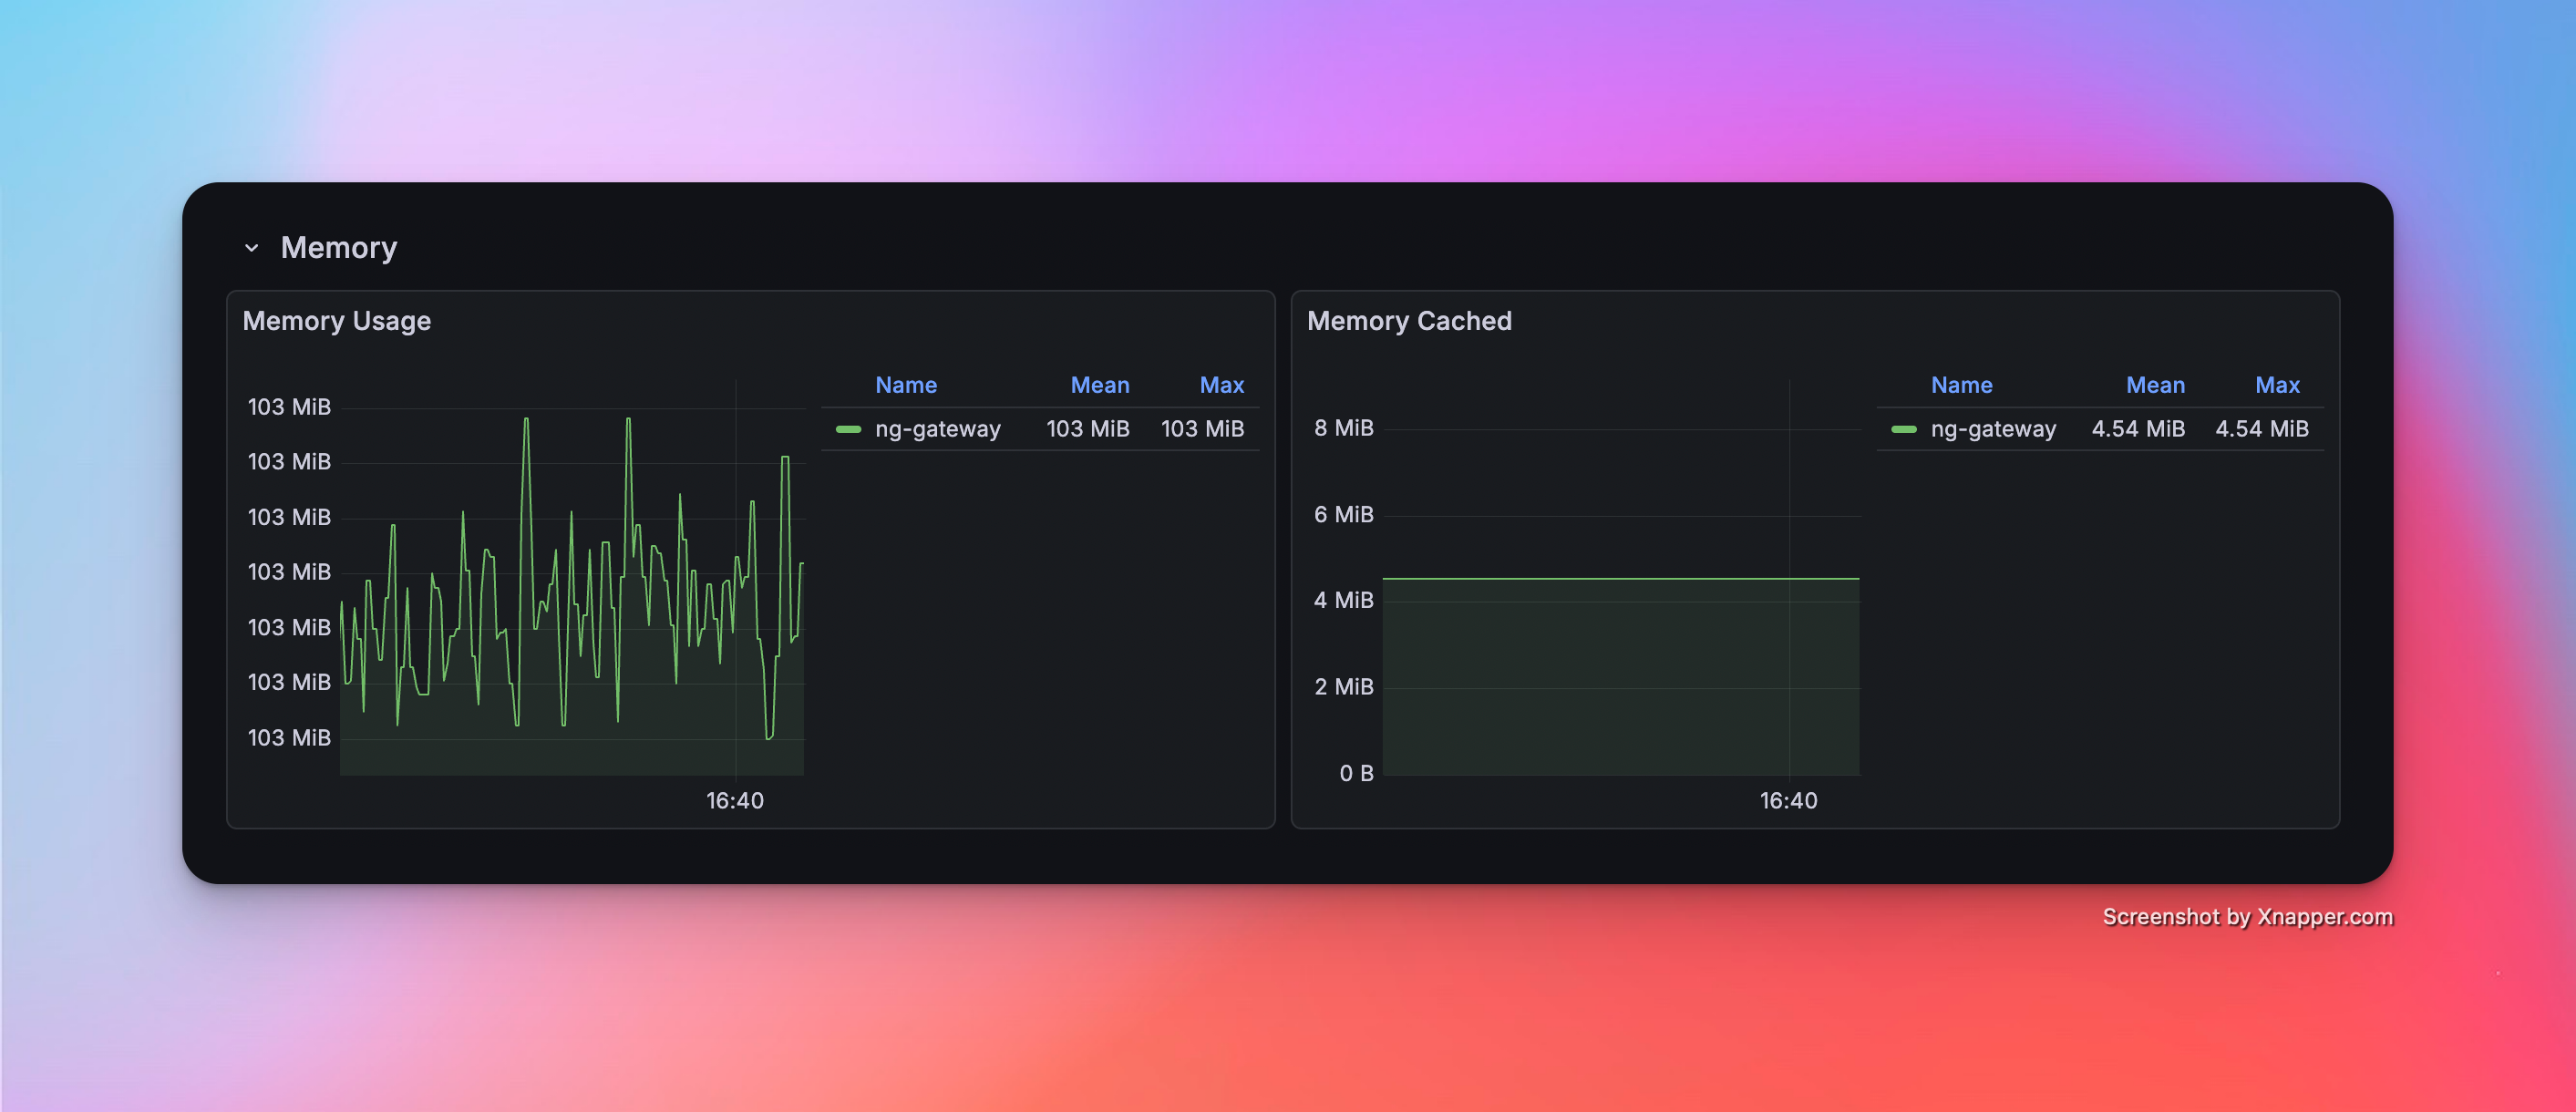
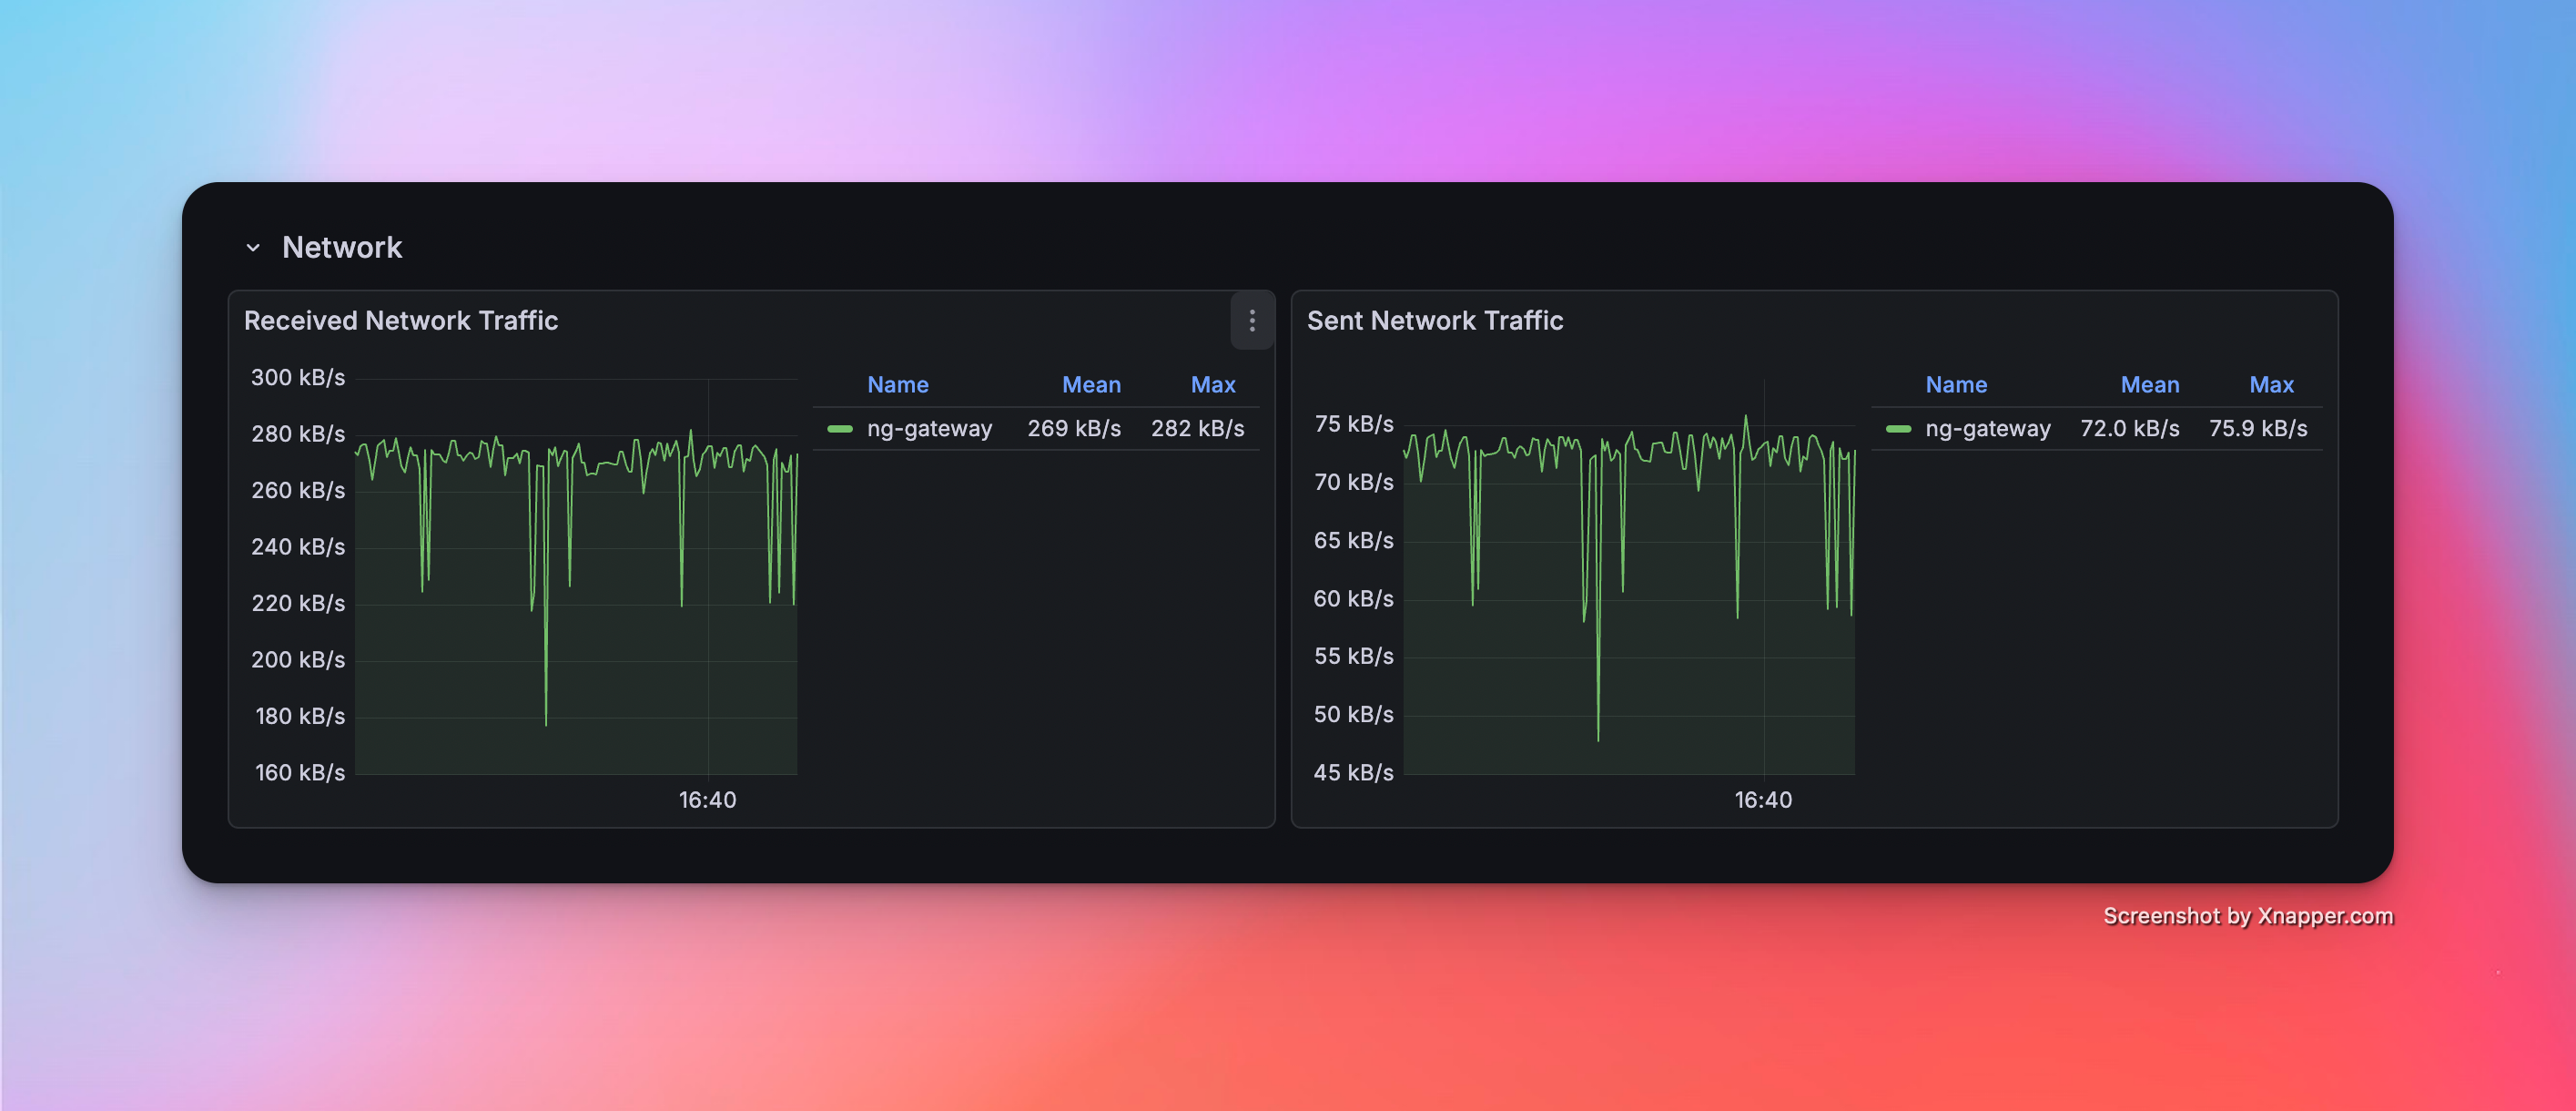
Scenario 2: Medium Scale Collection
- Config: 5 Channels · 10 Devices · 1,000 Points/Device · 1000 ms Period (Total 50,000 Points)
Metrics
| Memory | CPU | Network Bandwidth |
|---|---|---|
| 103 MiB | 4.41% | rx: 269.0 kB/s tx: 72.0 kB/s |
Resource Monitor Screenshots

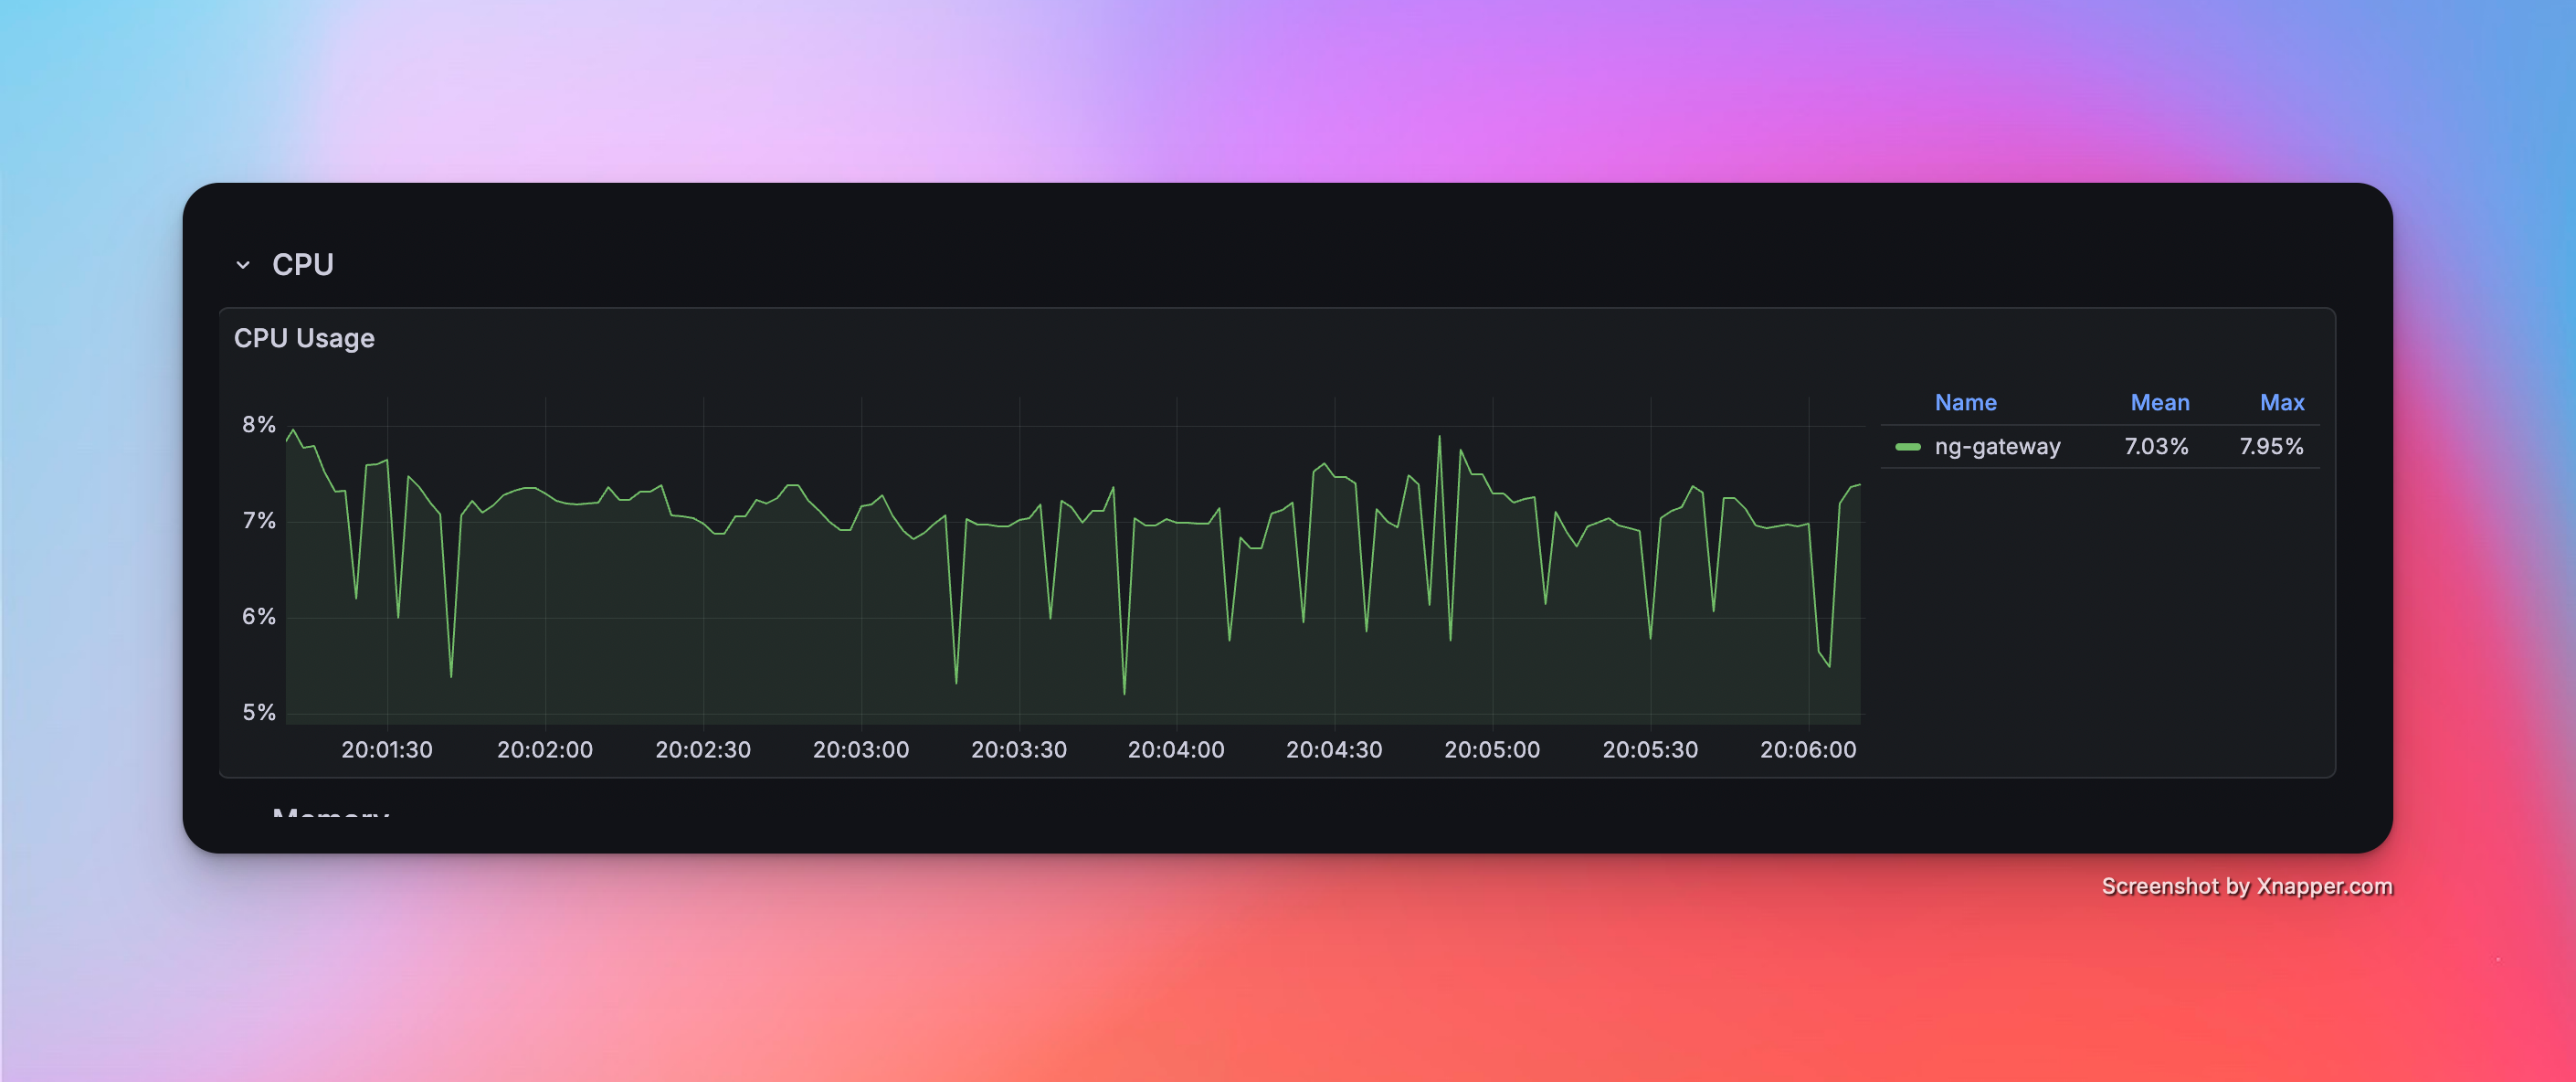
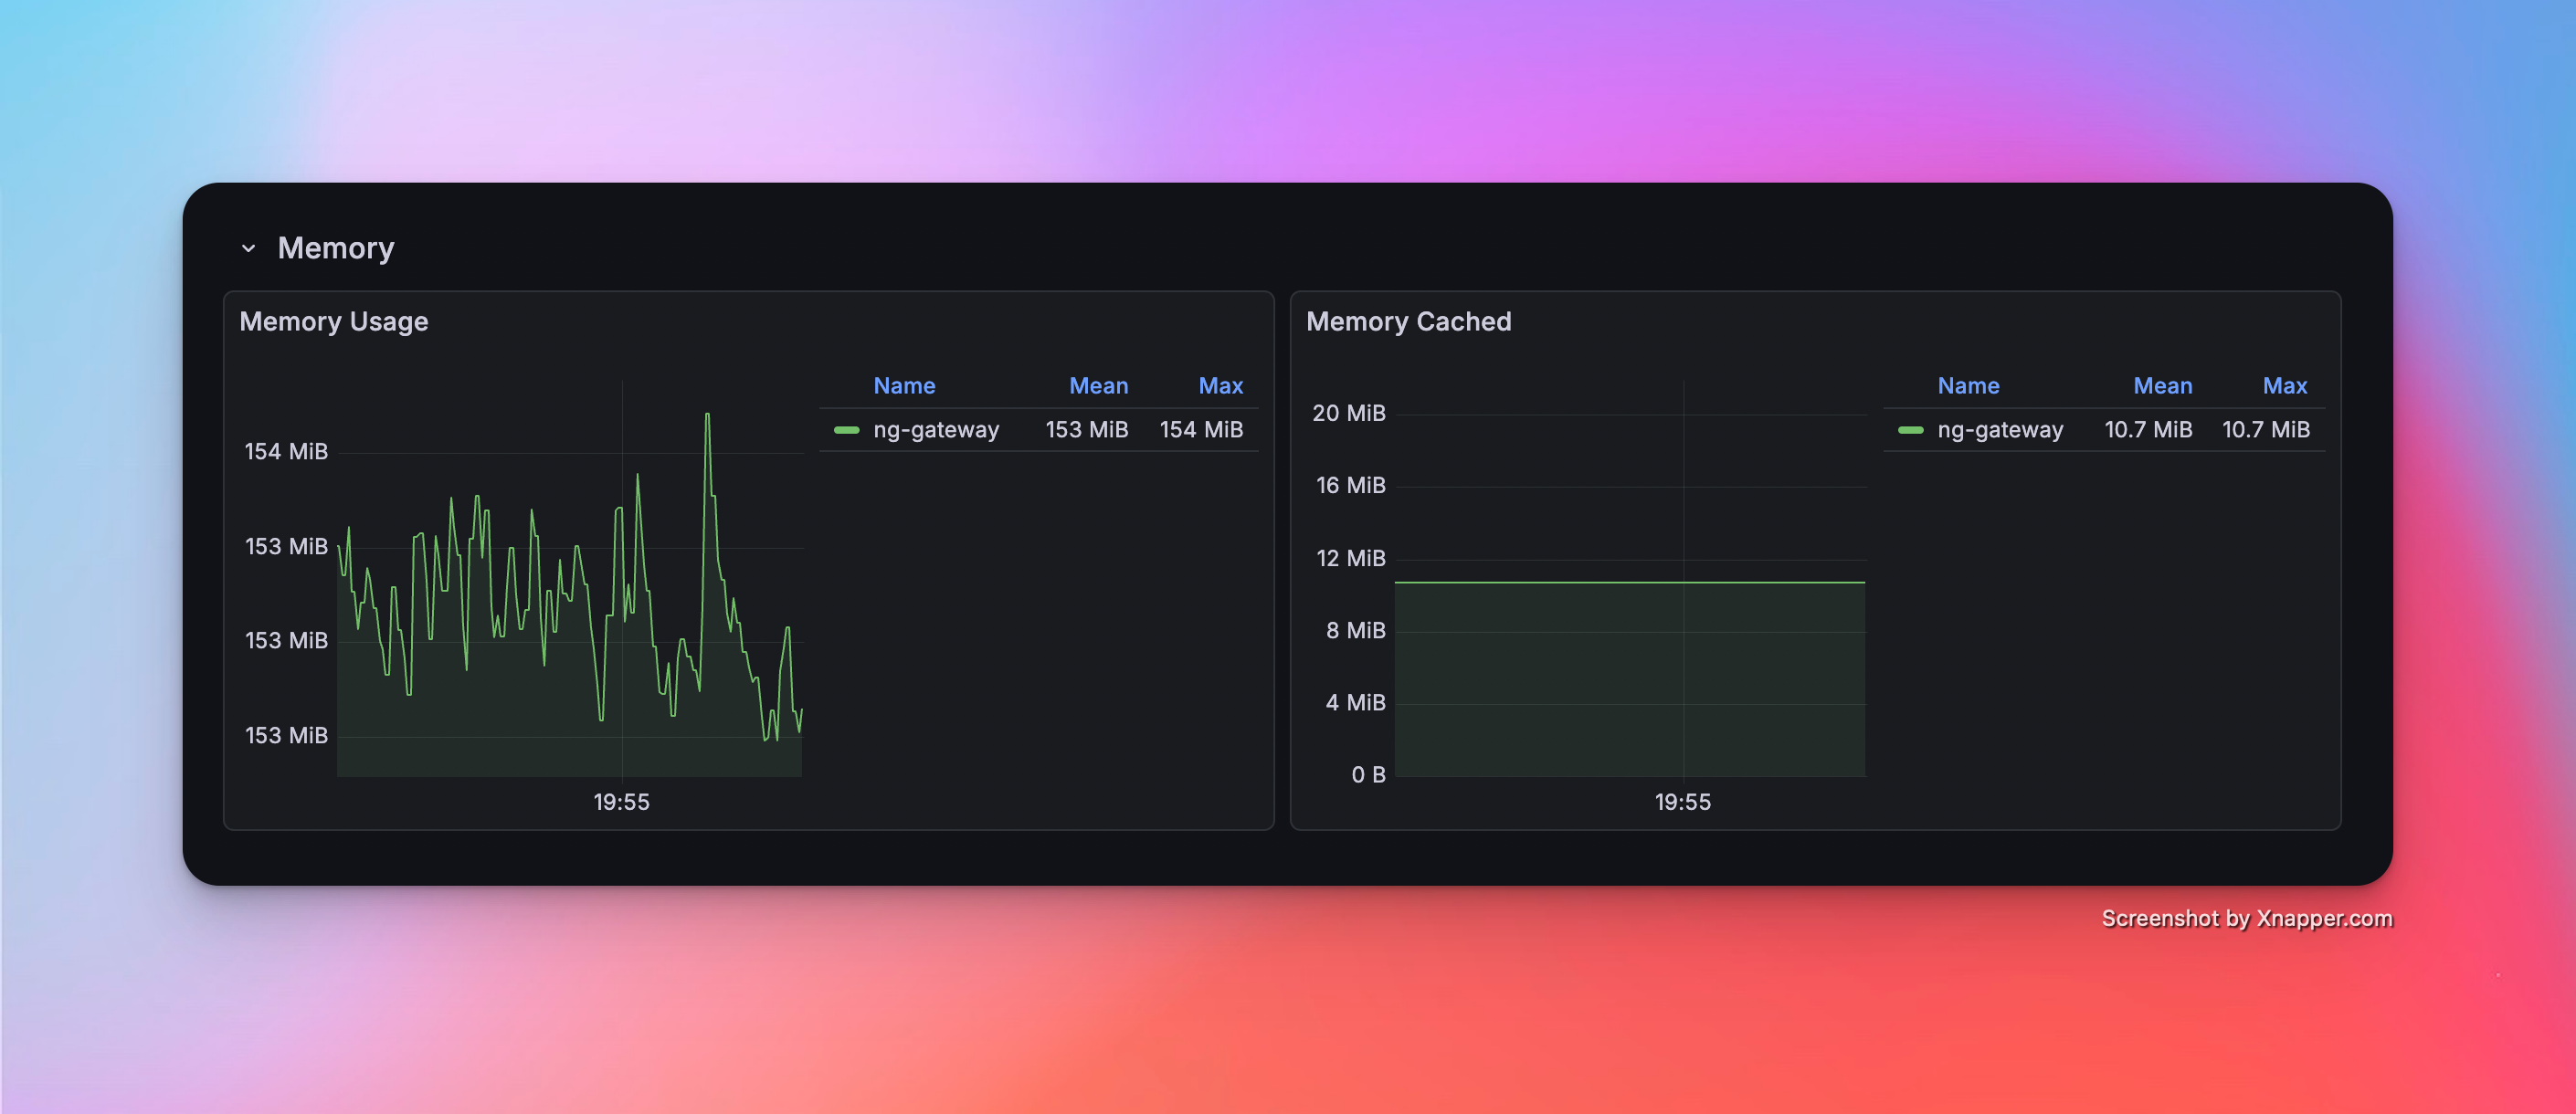
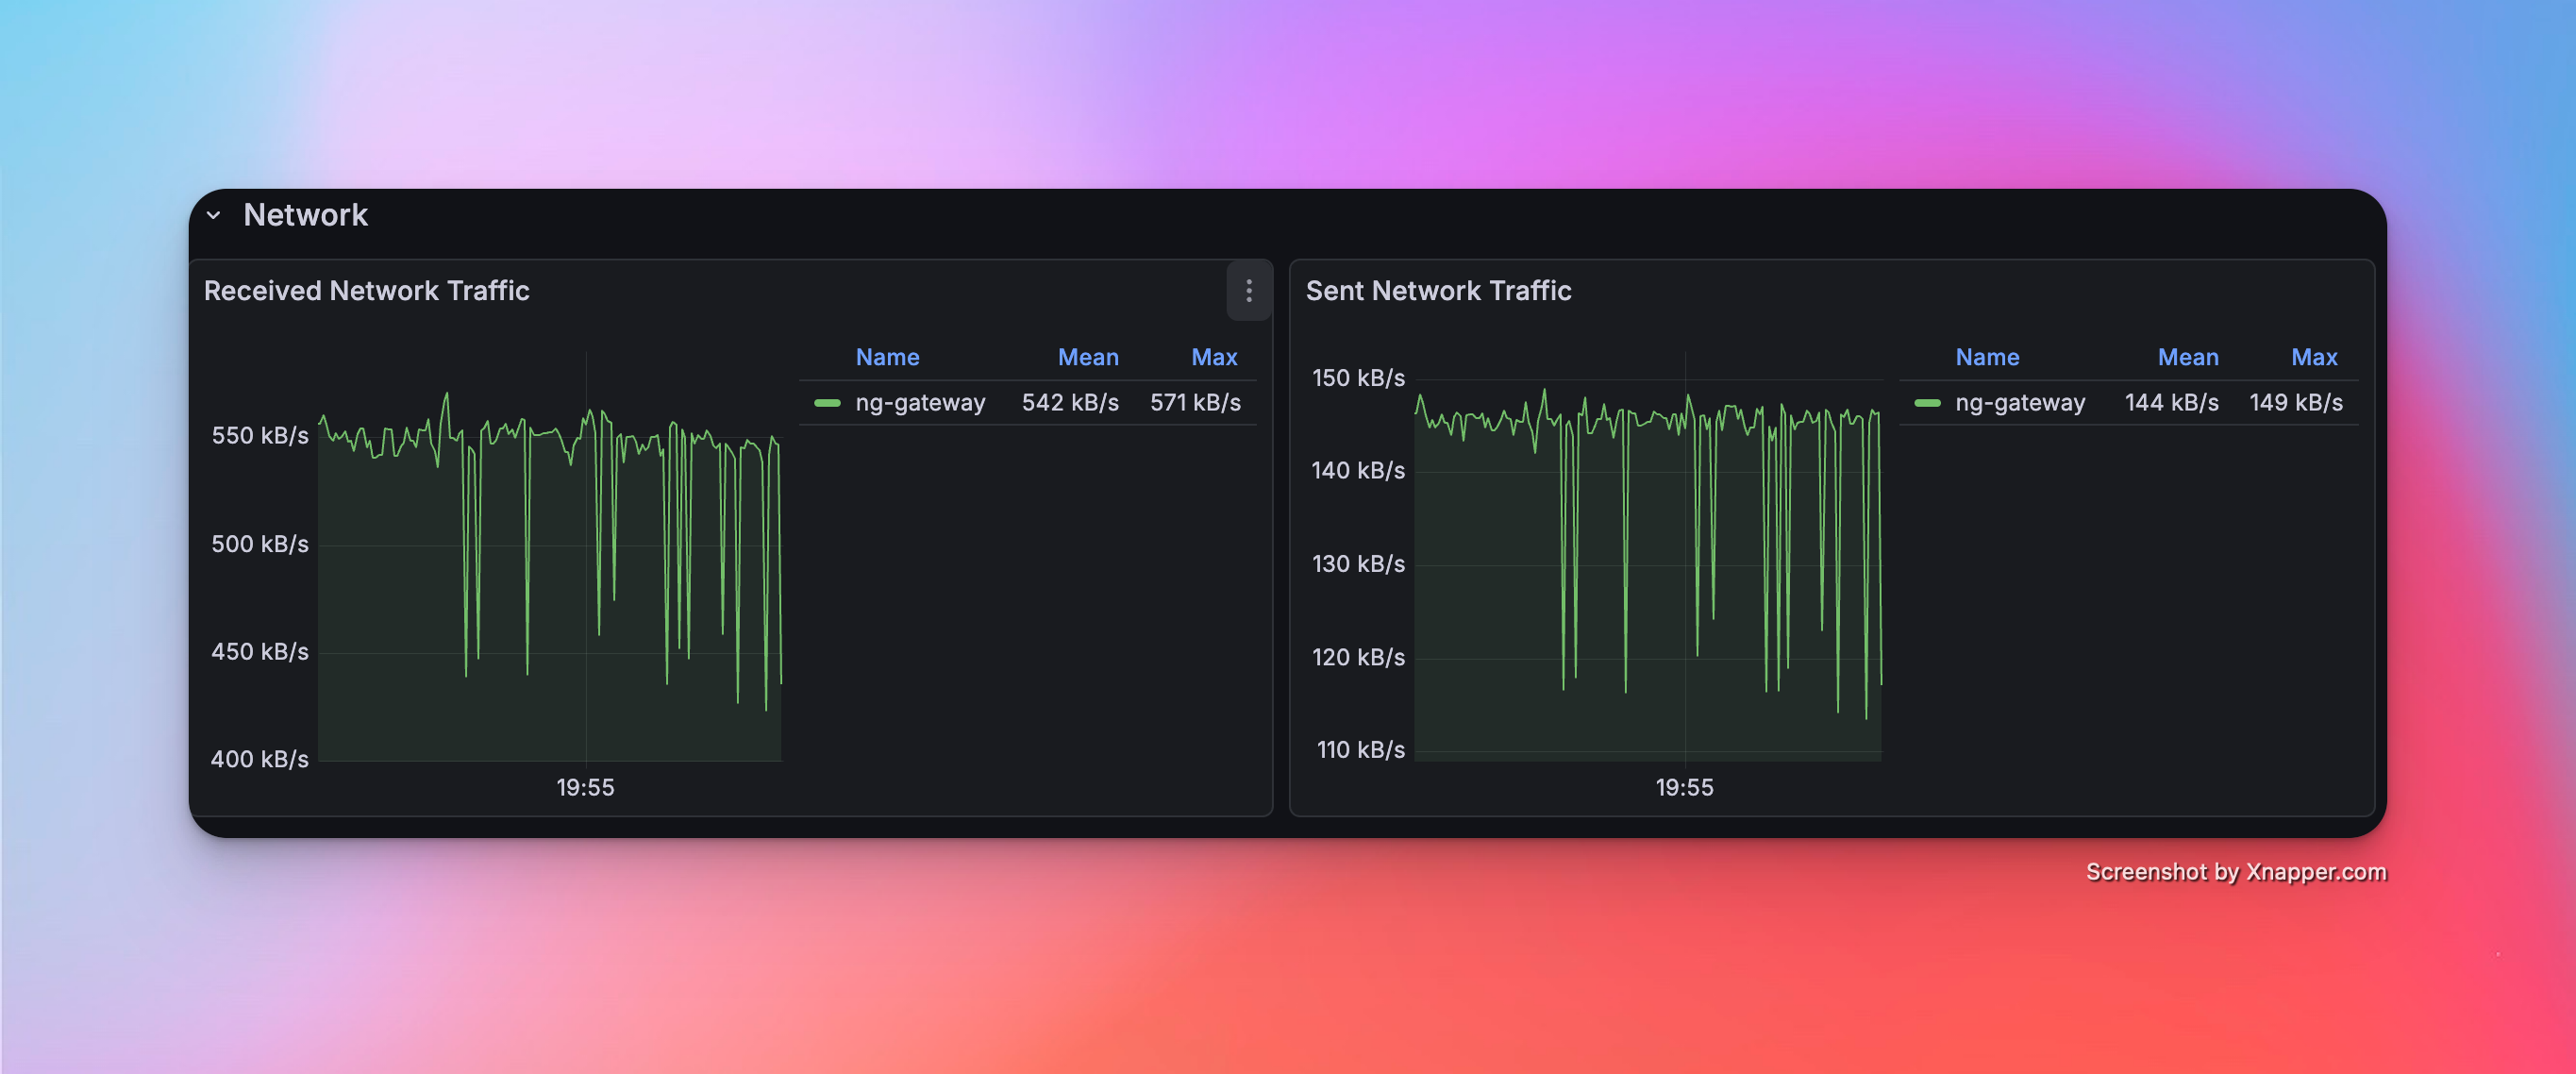
Scenario 3: Large Scale Collection
- Config: 10 Channels · 10 Devices · 1,000 Points/Device · 1000 ms Period (Total 100,000 Points)
Metrics
| Memory | CPU | Network Bandwidth |
|---|---|---|
| 153 MiB | 7.03% | rx: 542.0 kB/s tx: 144.0 kB/s |
Resource Monitor Screenshots
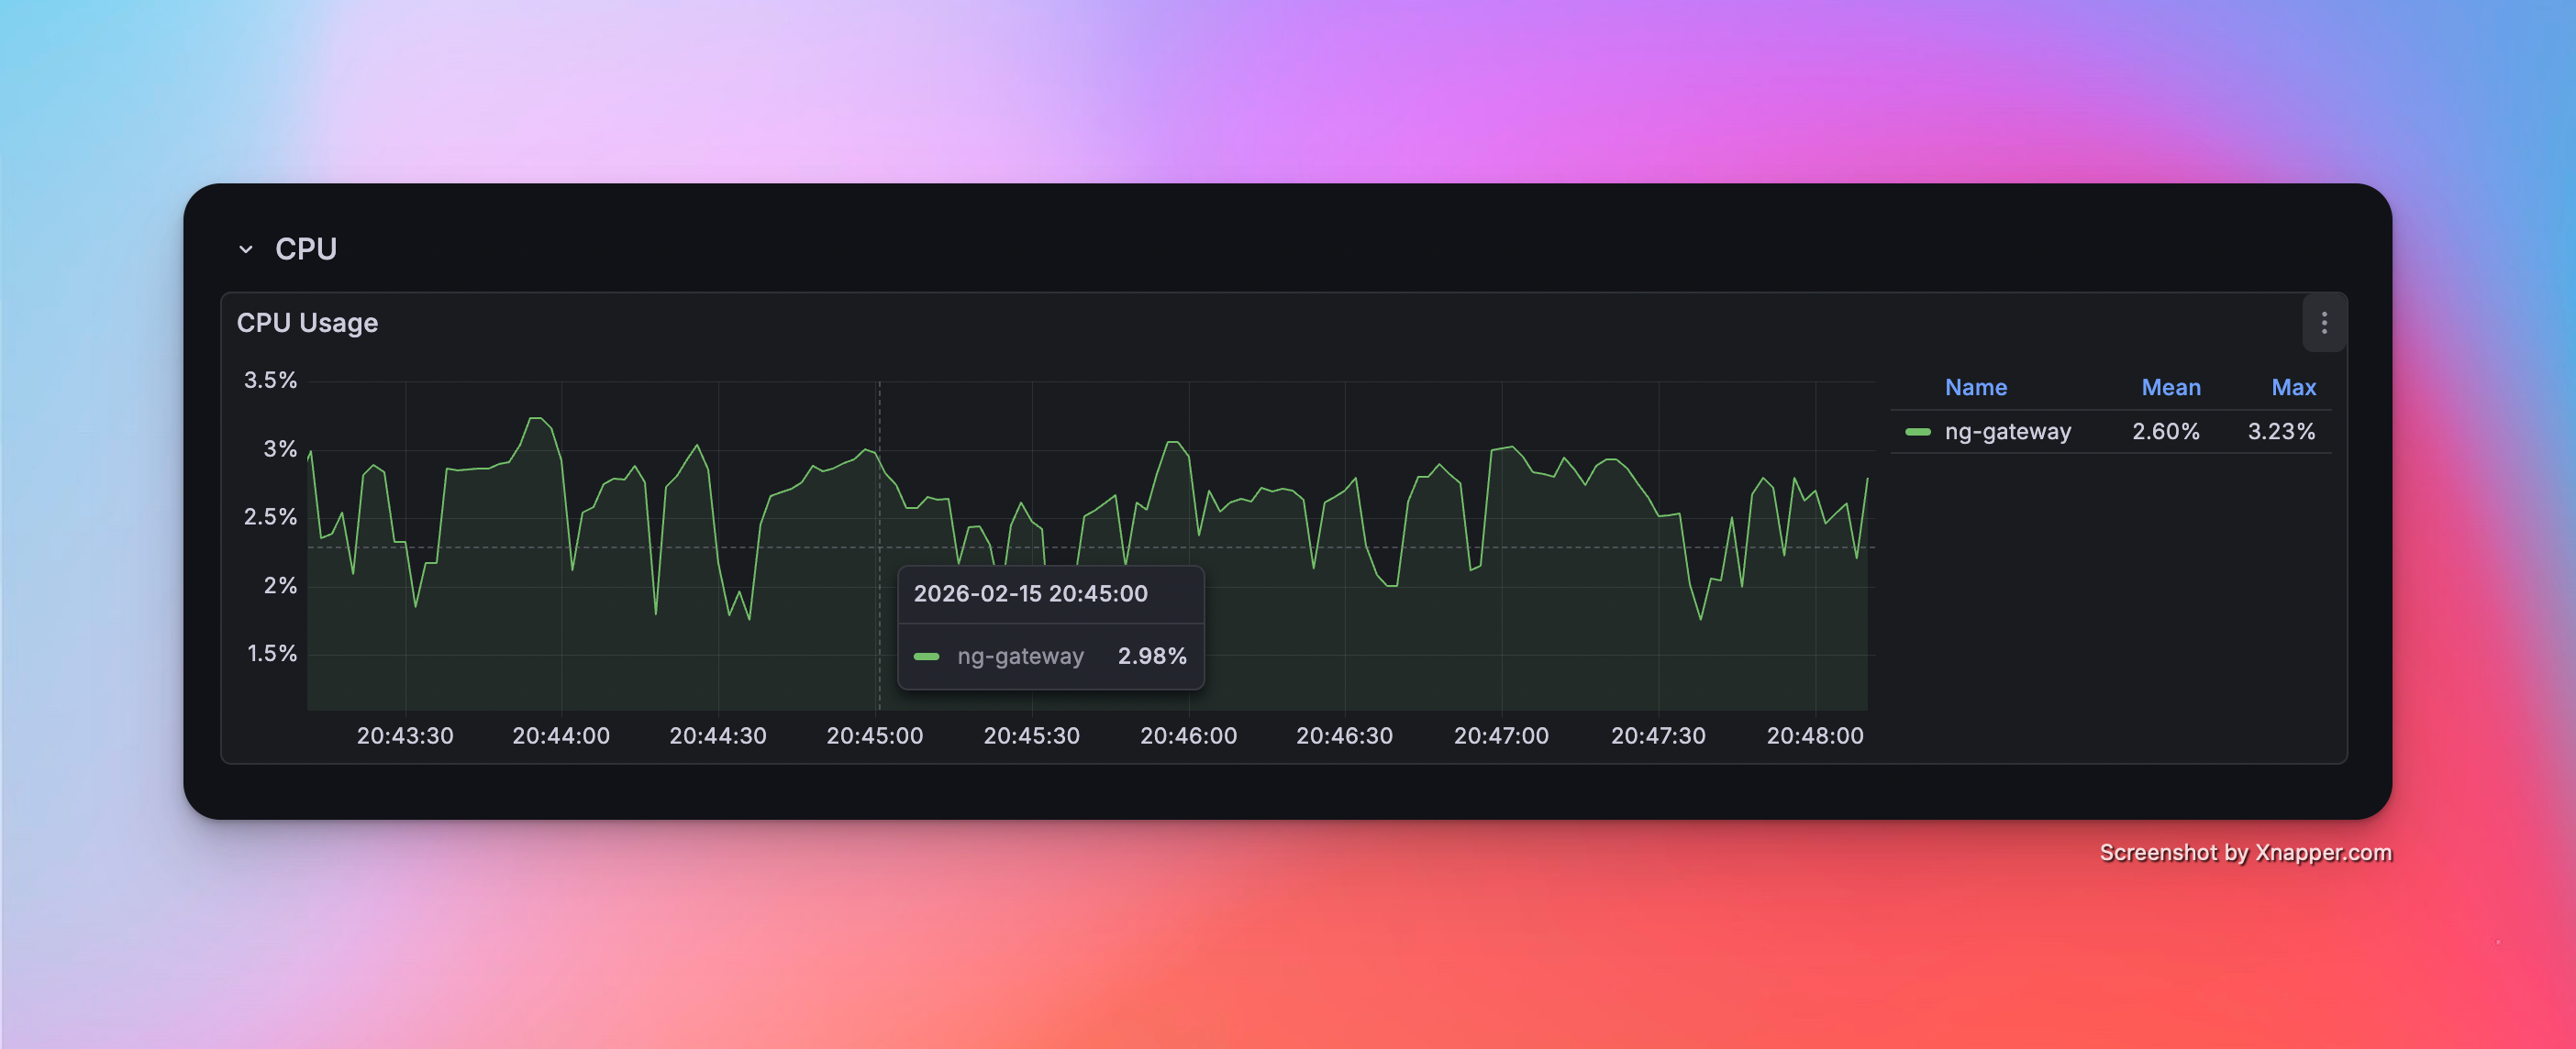
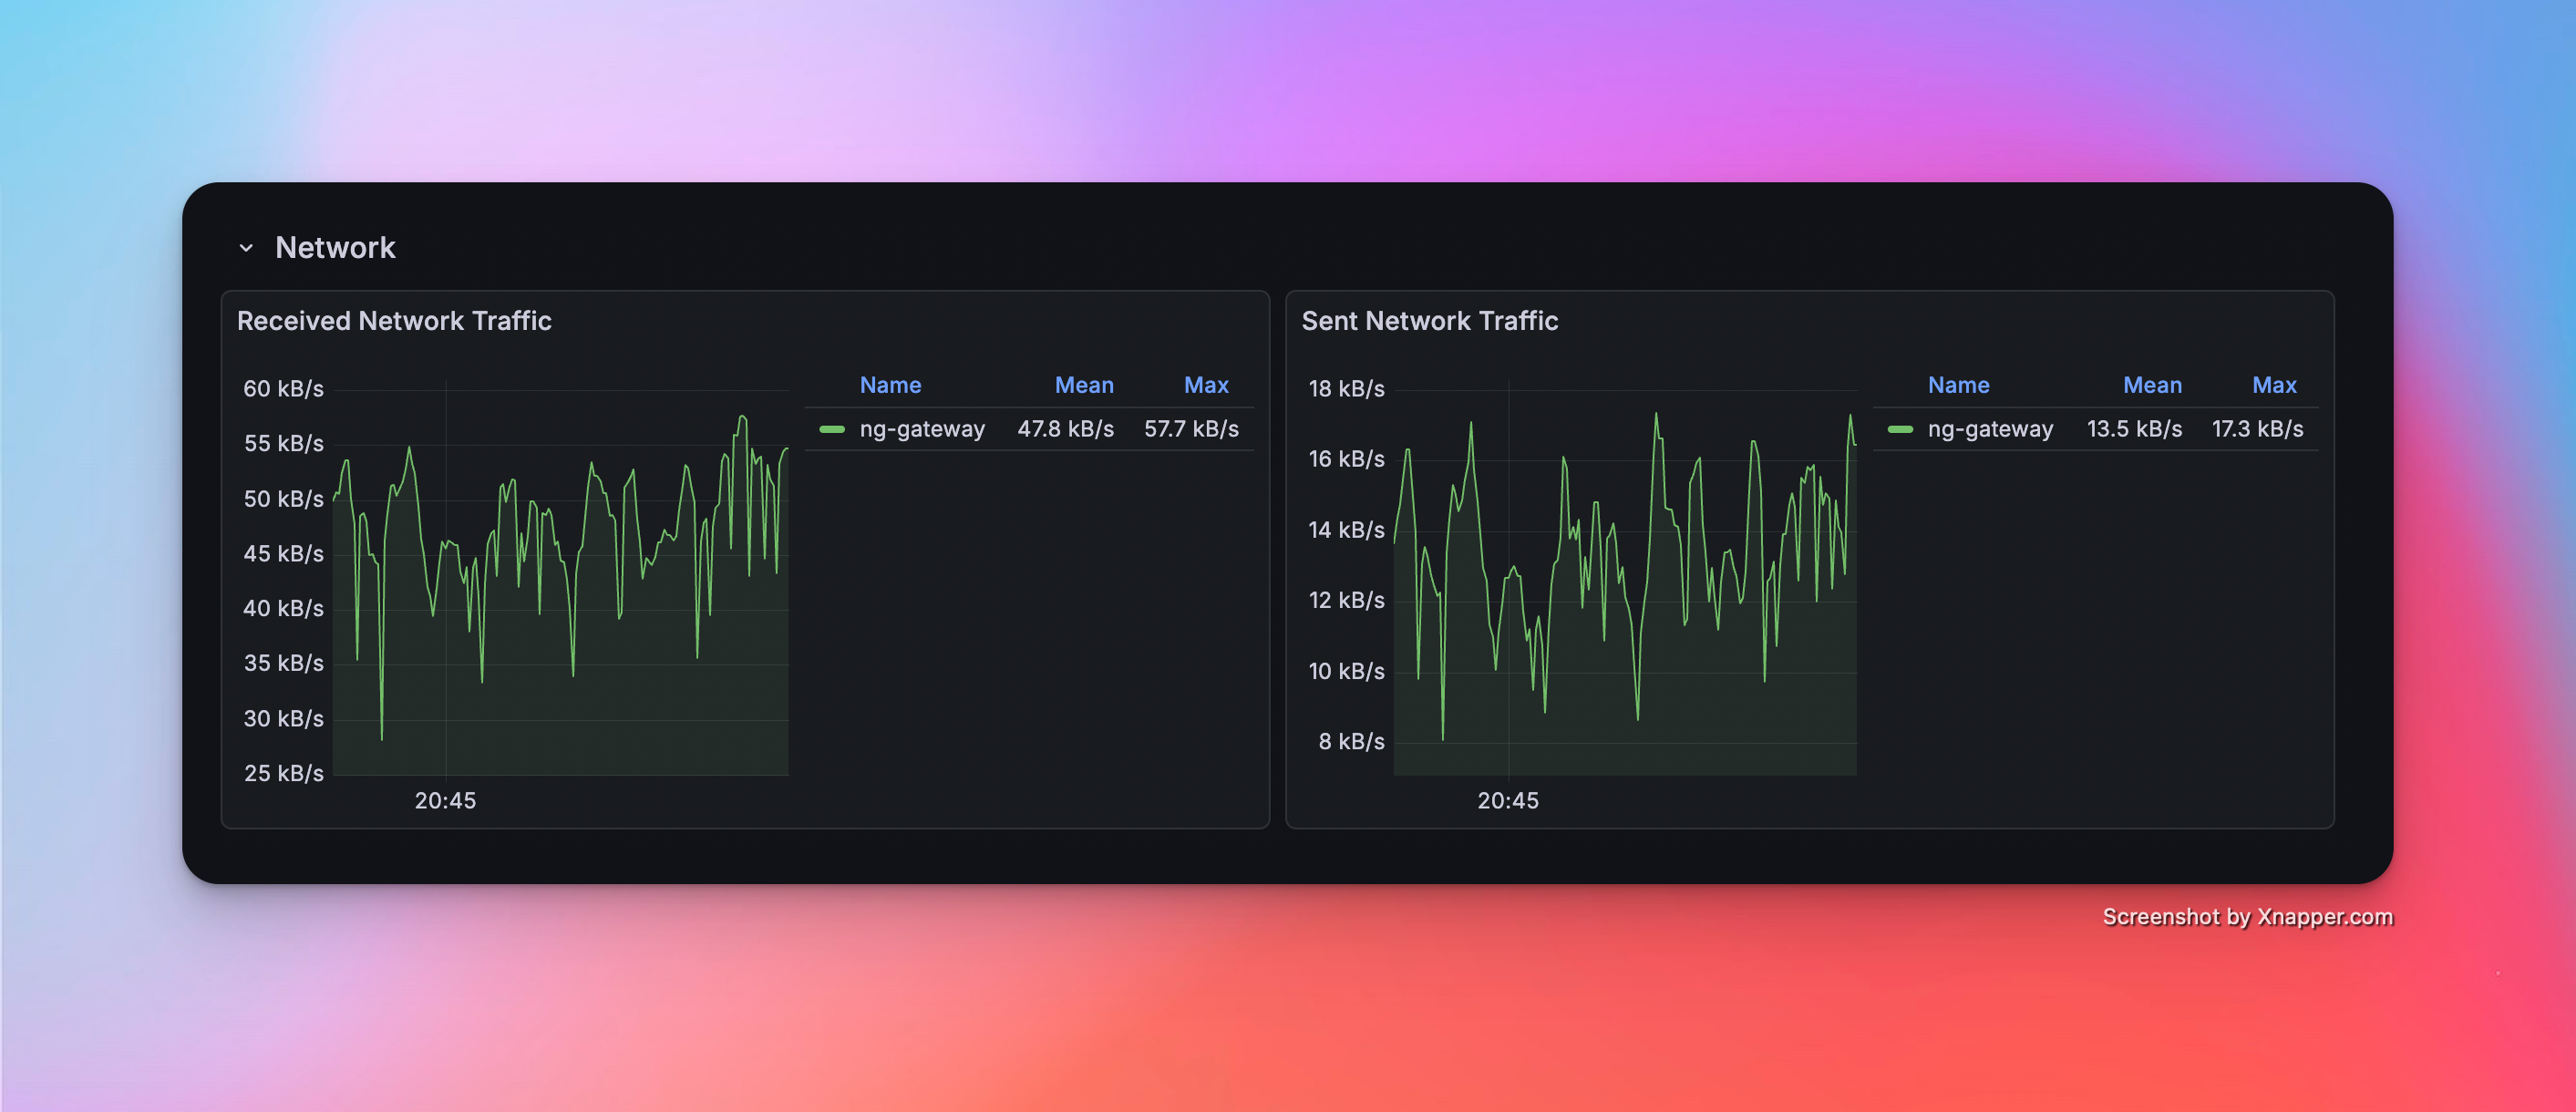
Scenario 4: High Frequency (Single Channel)
- Config: 1 Channel · 1 Device · 1,000 Points/Device · 100 ms Period (Total 1,000 Points)
Metrics
| Memory | CPU | Network Bandwidth |
|---|---|---|
| 44.8 MiB | 2.60% | rx: 47.8 kB/s tx: 13.5 kB/s |
Resource Monitor Screenshots

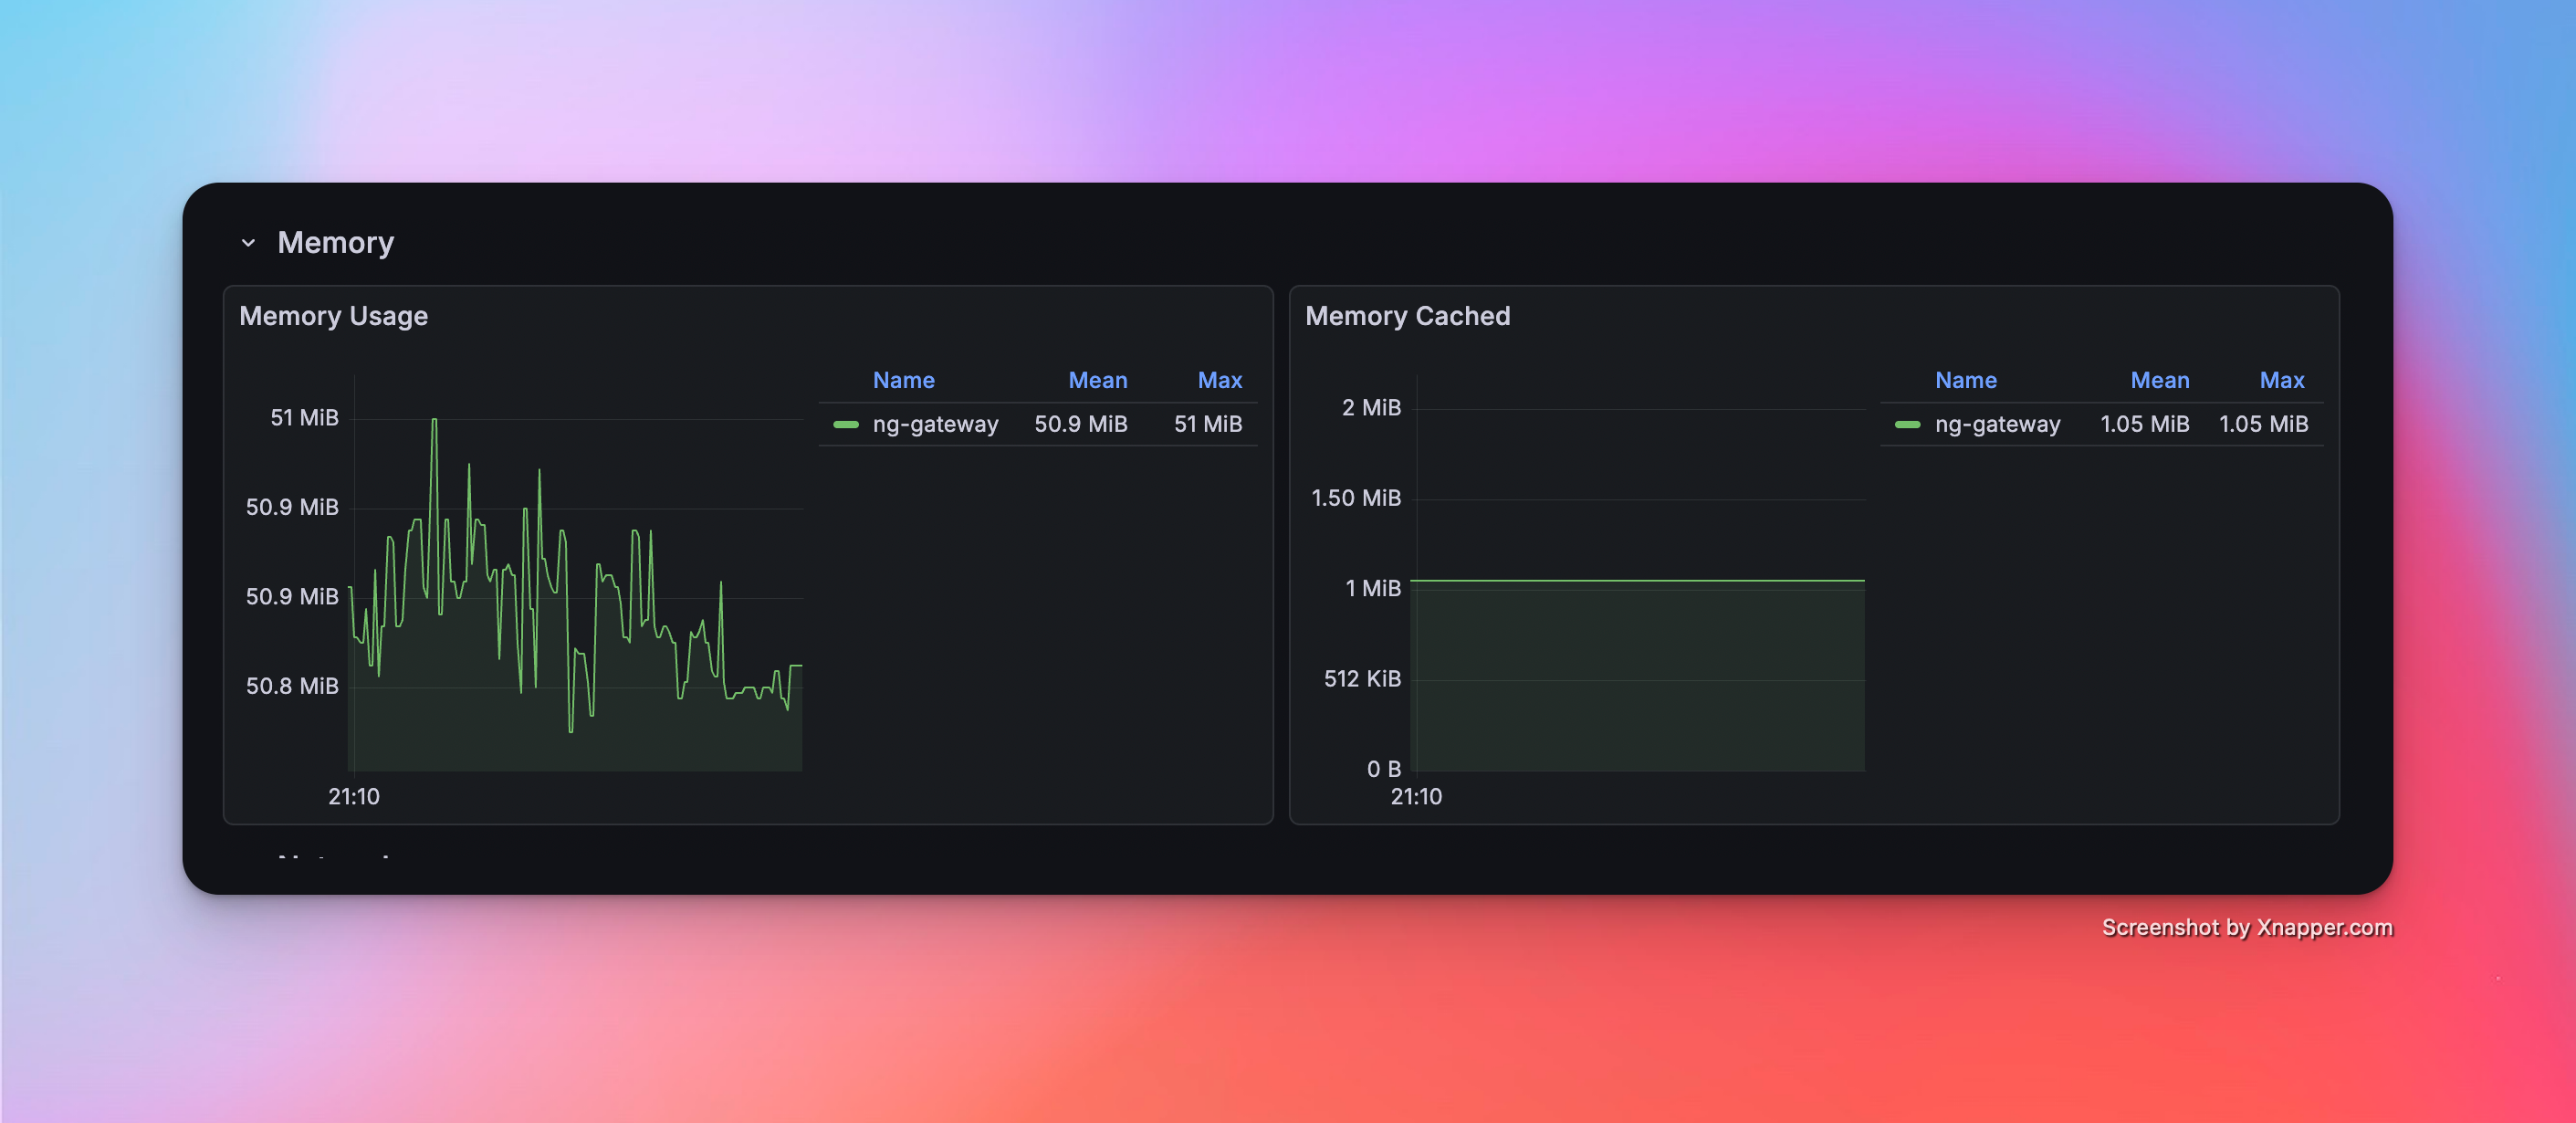
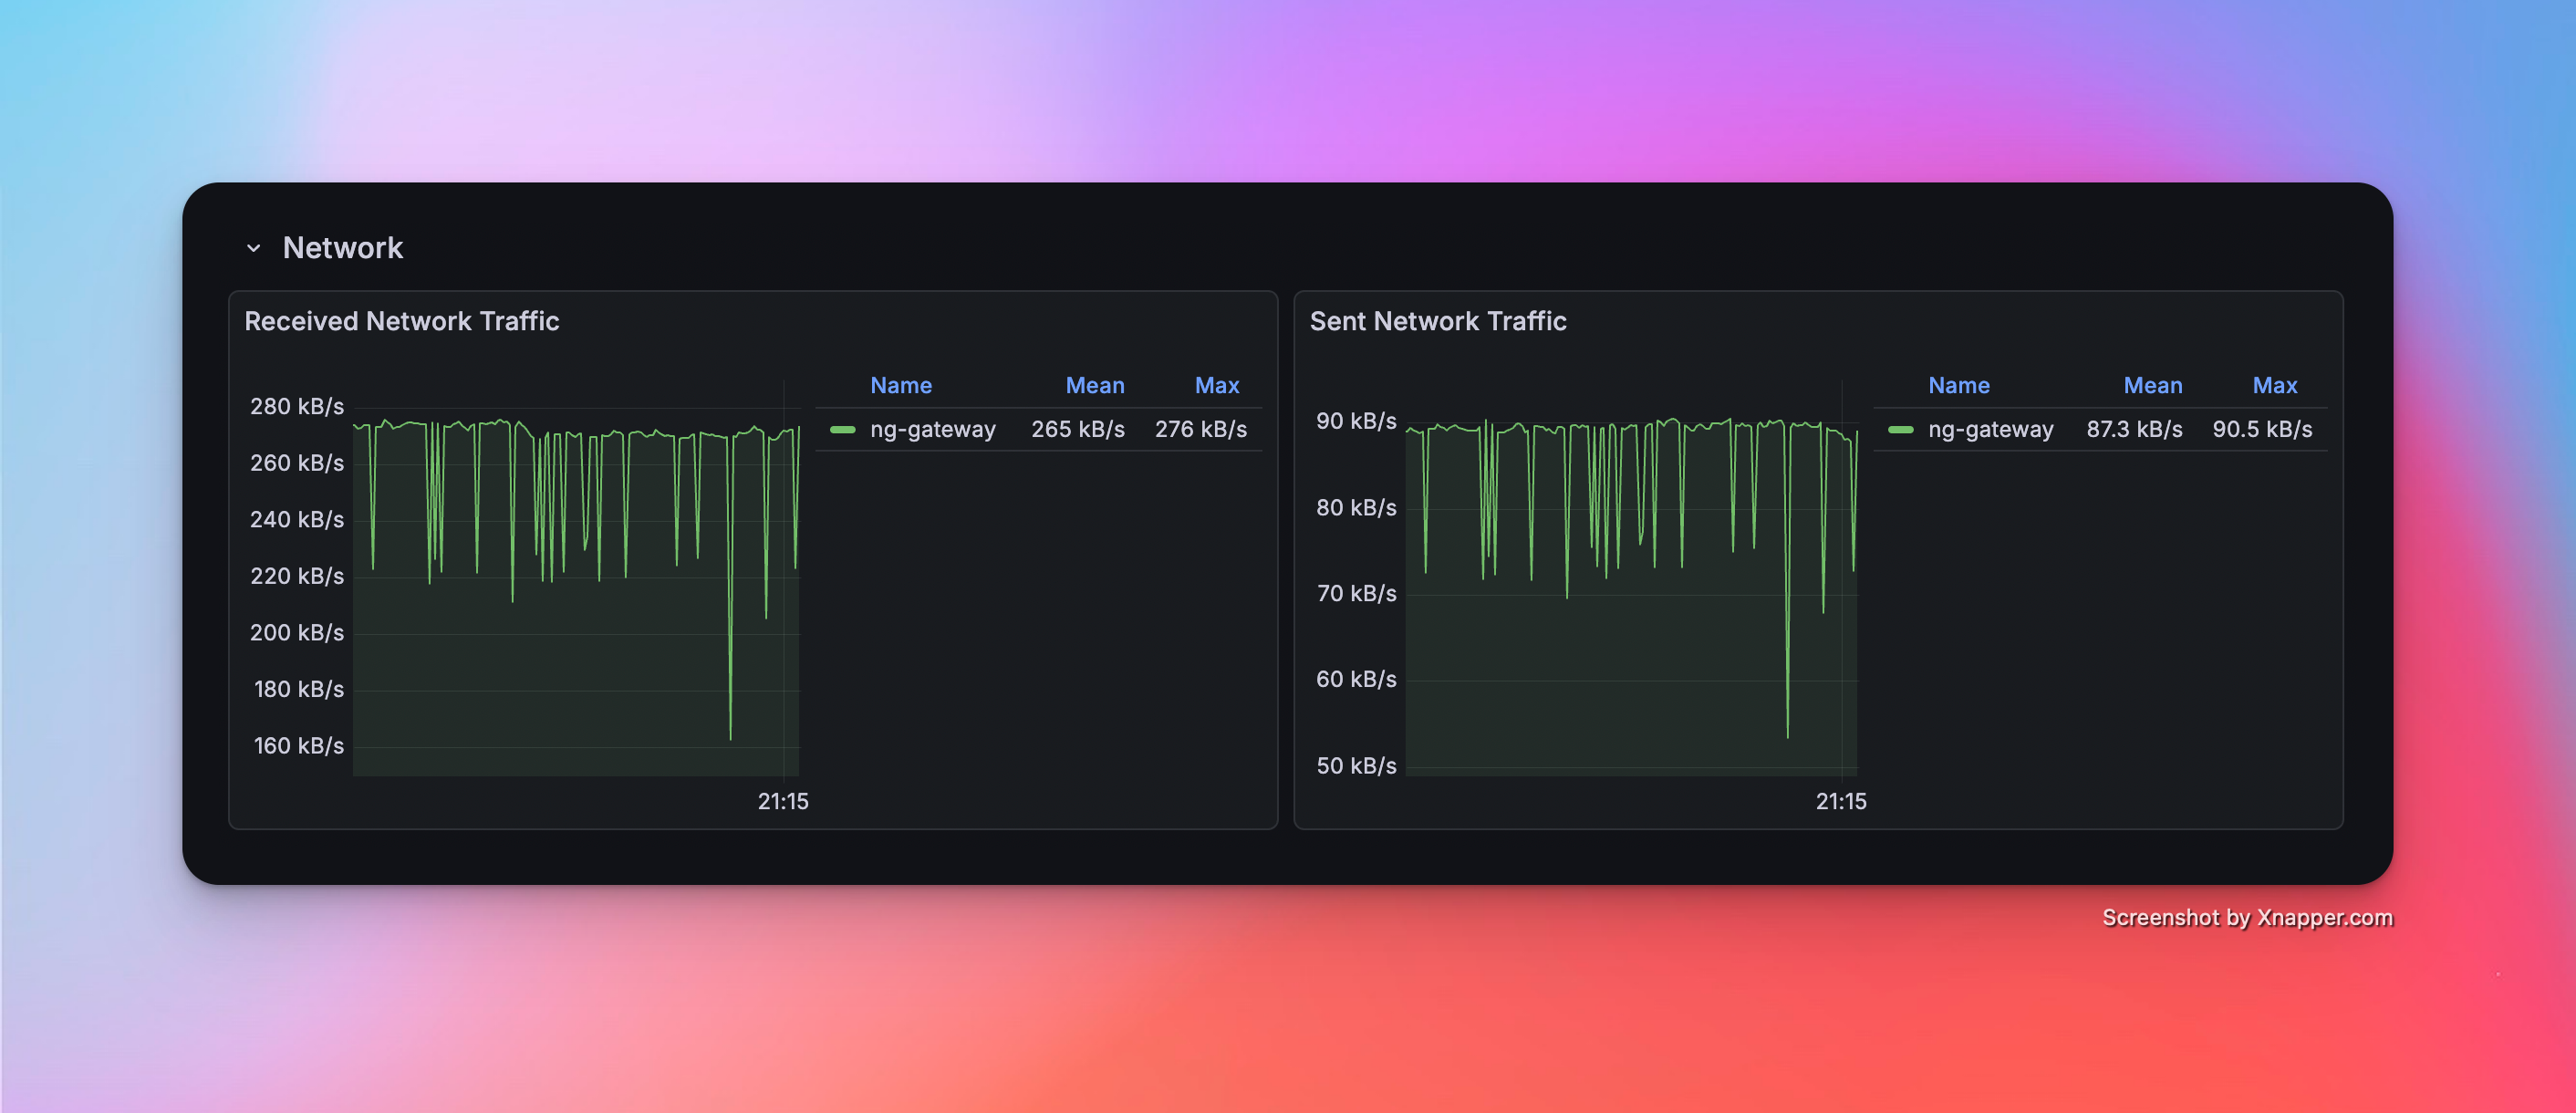
Scenario 5: High Frequency (Multi Channel)
- Config: 5 Channels · 1 Device · 1,000 Points/Device · 100 ms Period (Total 5,000 Points)
Metrics
| Memory | CPU | Network Bandwidth |
|---|---|---|
| 50.9 MiB | 4.61% | rx: 265.0 kB/s tx: 87.3 kB/s |
Resource Monitor Screenshots

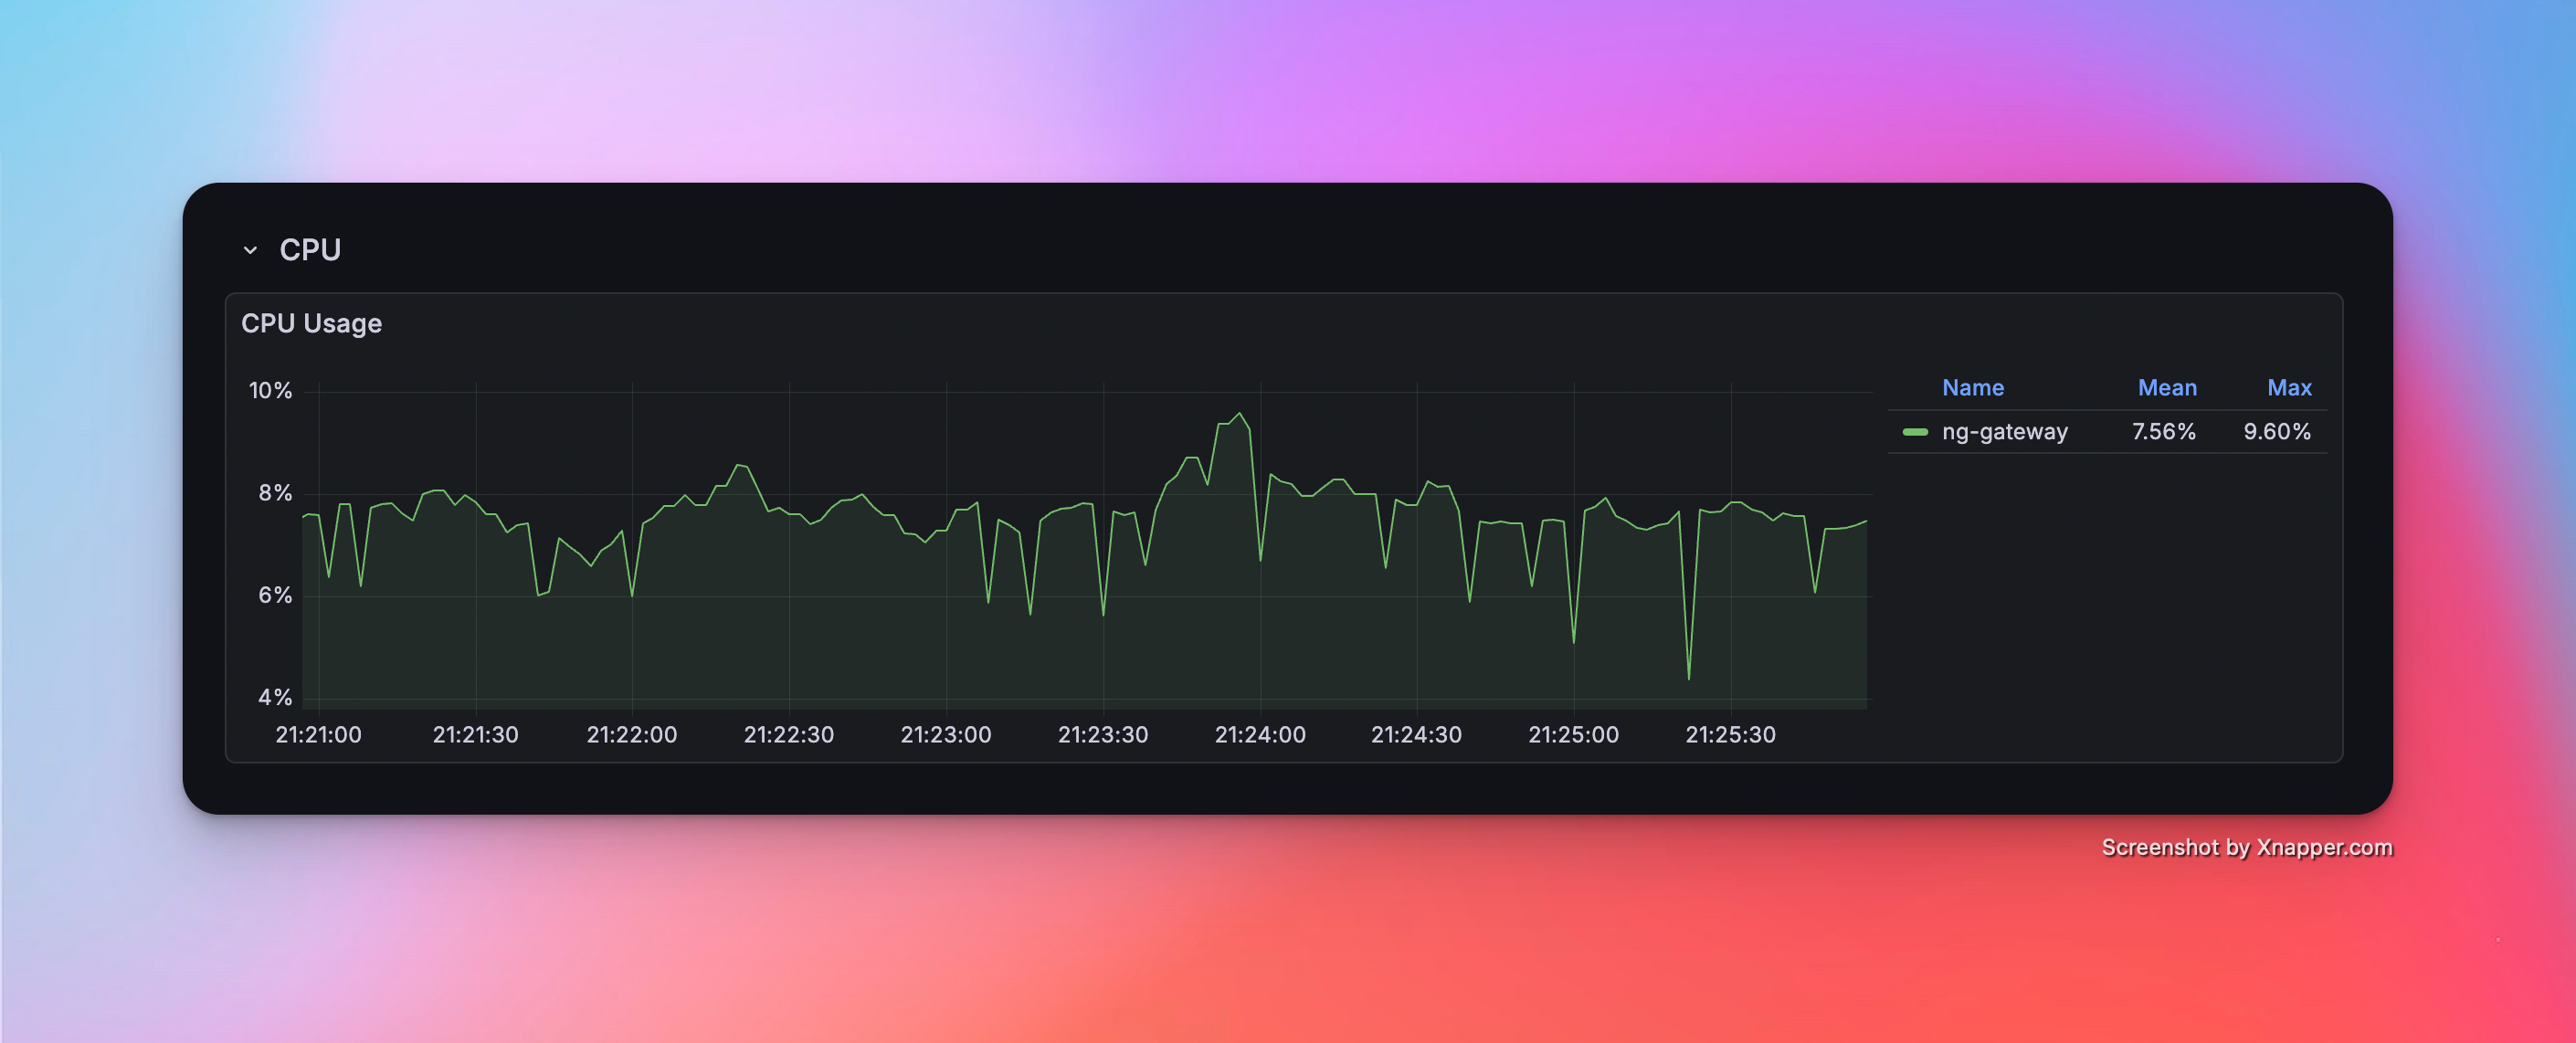
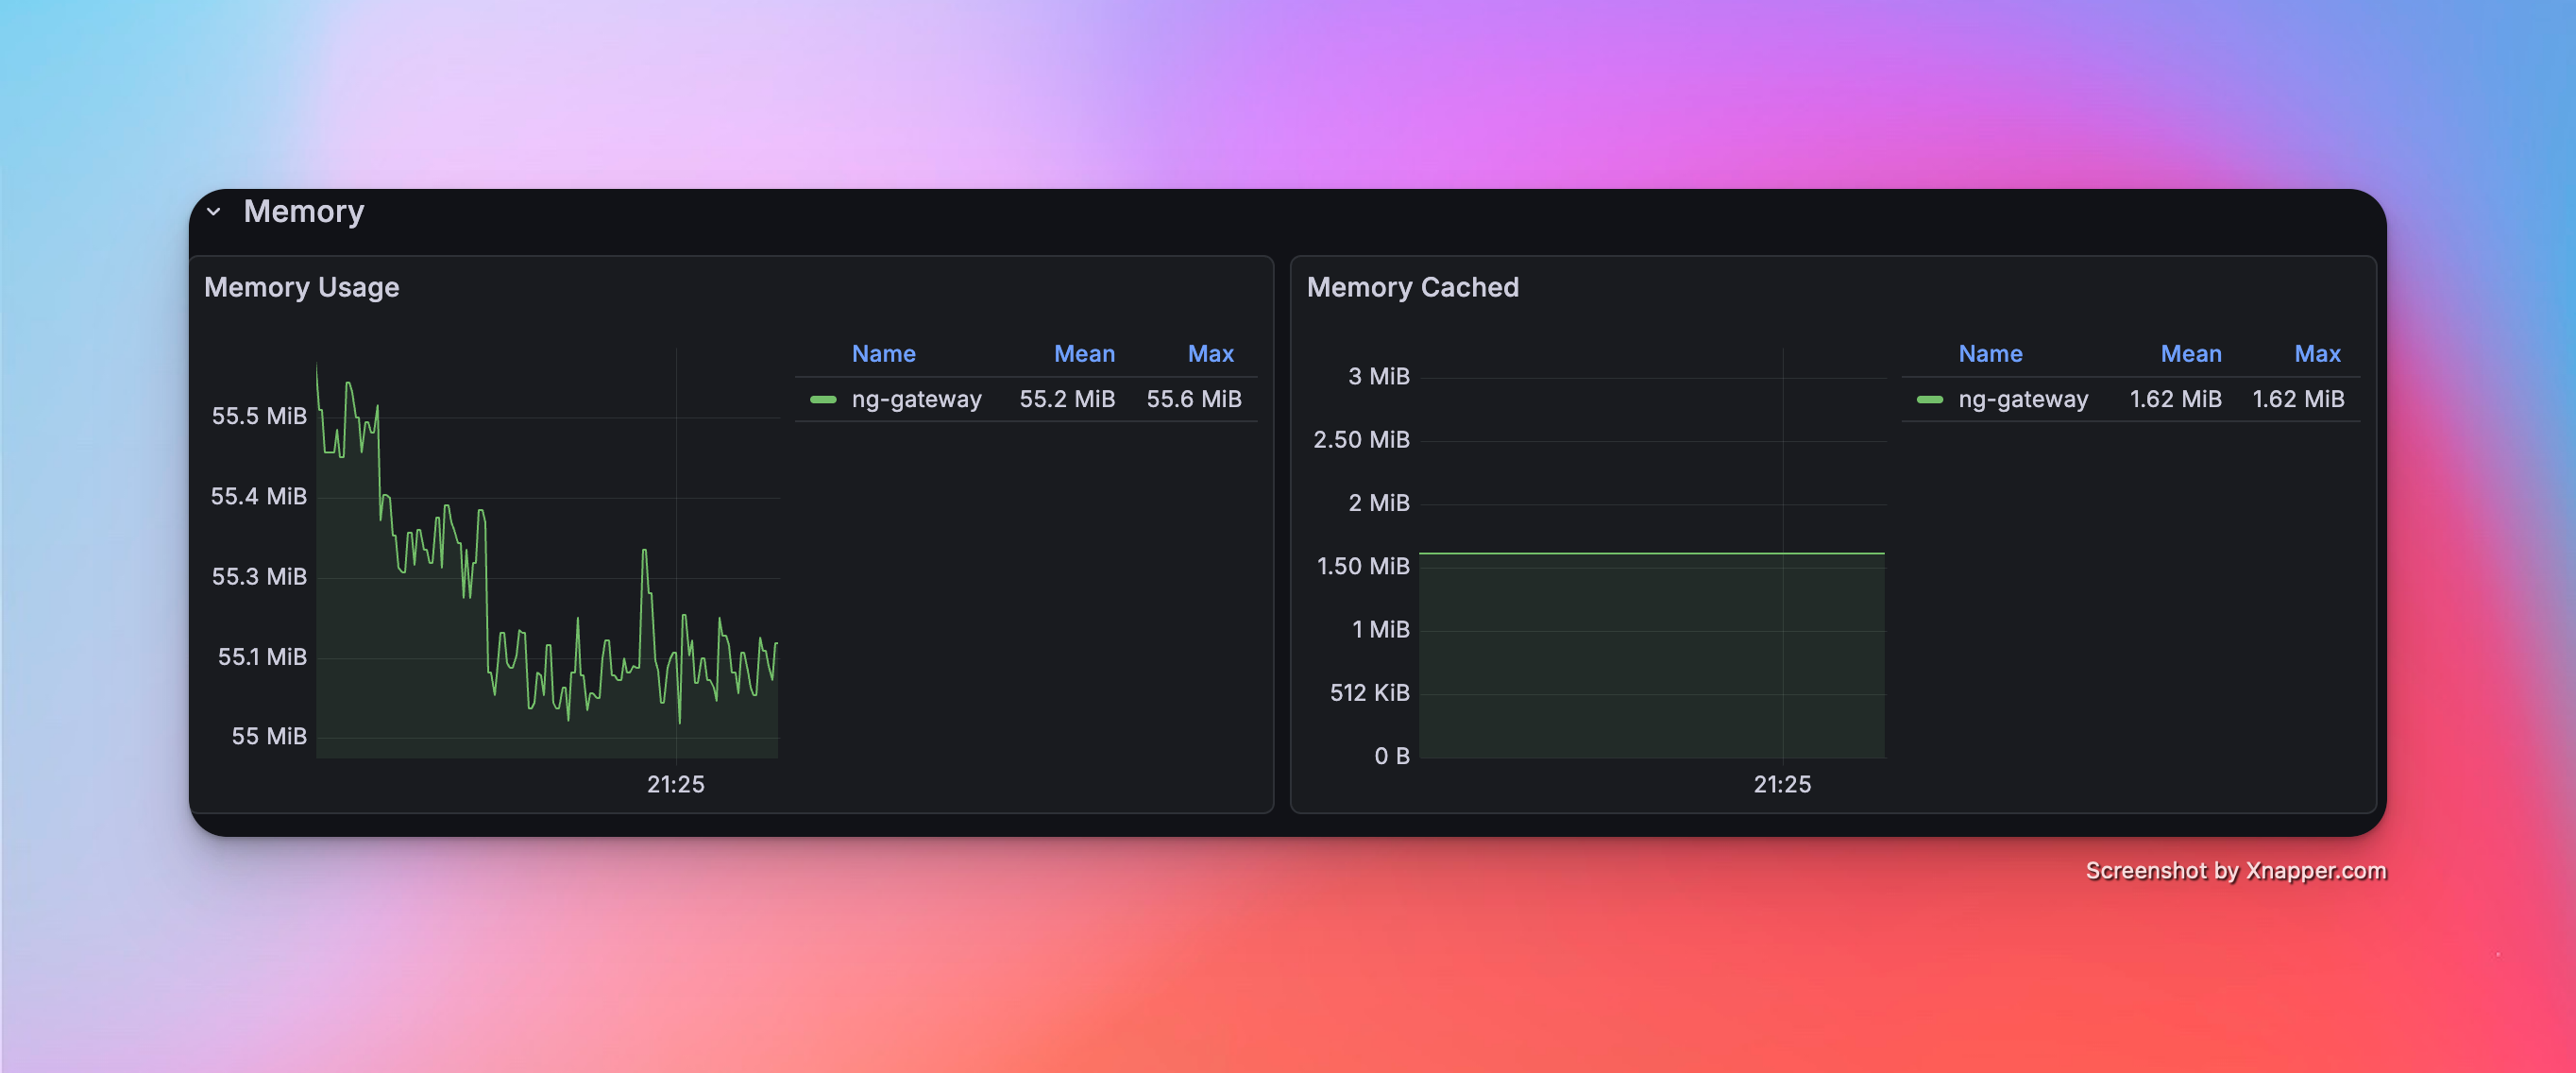
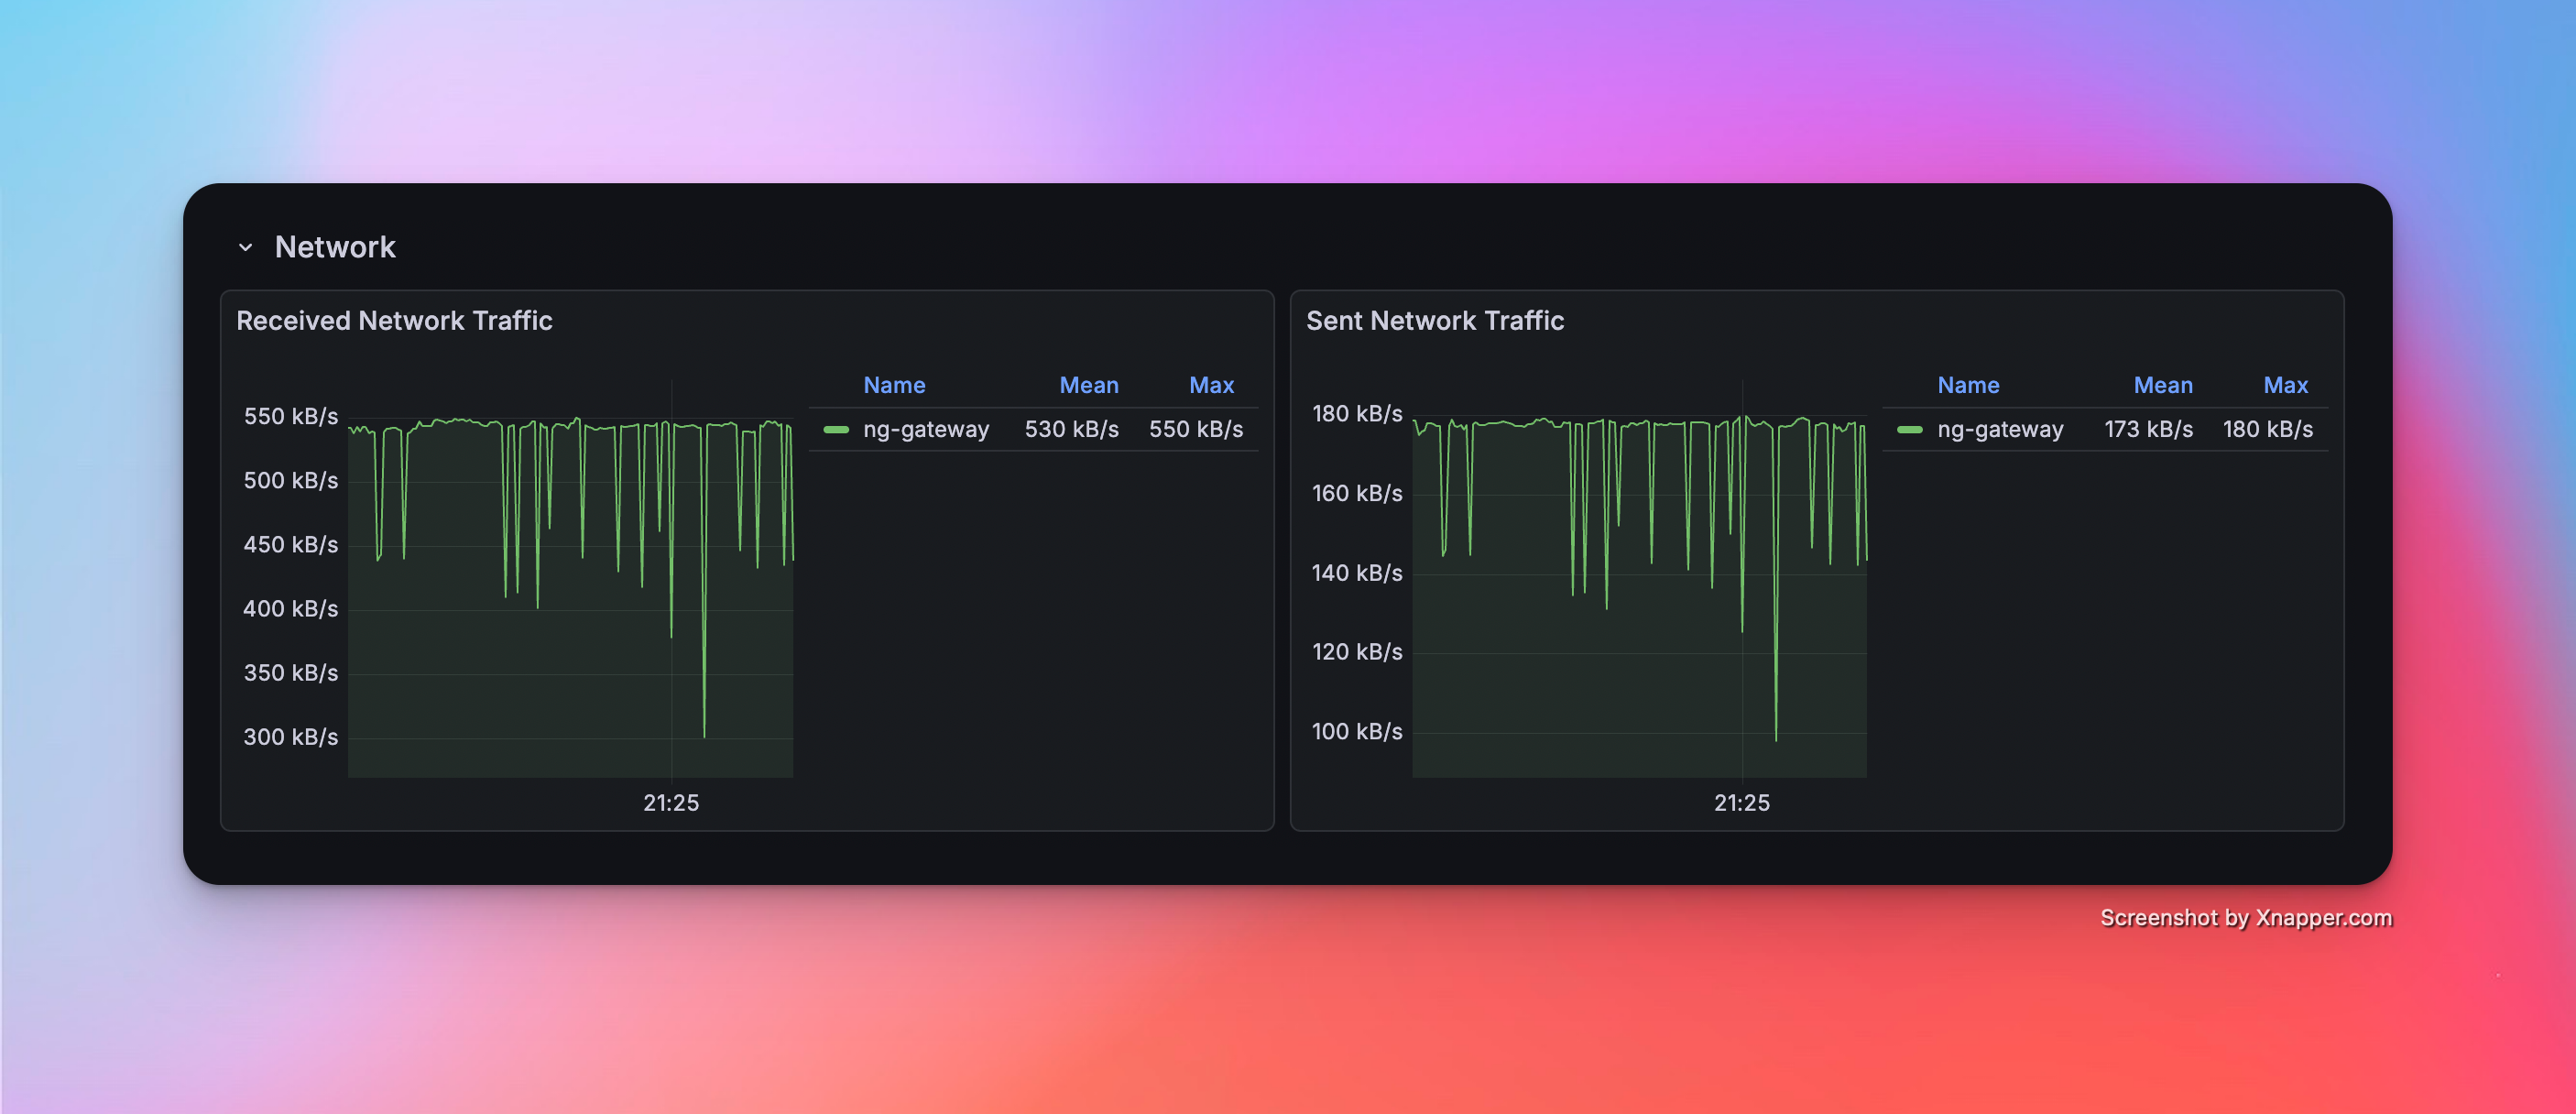
Scenario 6: High Frequency (Large Scale)
- Config: 10 Channels · 1 Device · 1,000 Points/Device · 100 ms Period (Total 10,000 Points)
Metrics
| Memory | CPU | Network Bandwidth |
|---|---|---|
| 55.2 Mib | 7.56% | rx: 530.0 kB/s tx: 173.0 kB/s |
Resource Monitor Screenshots
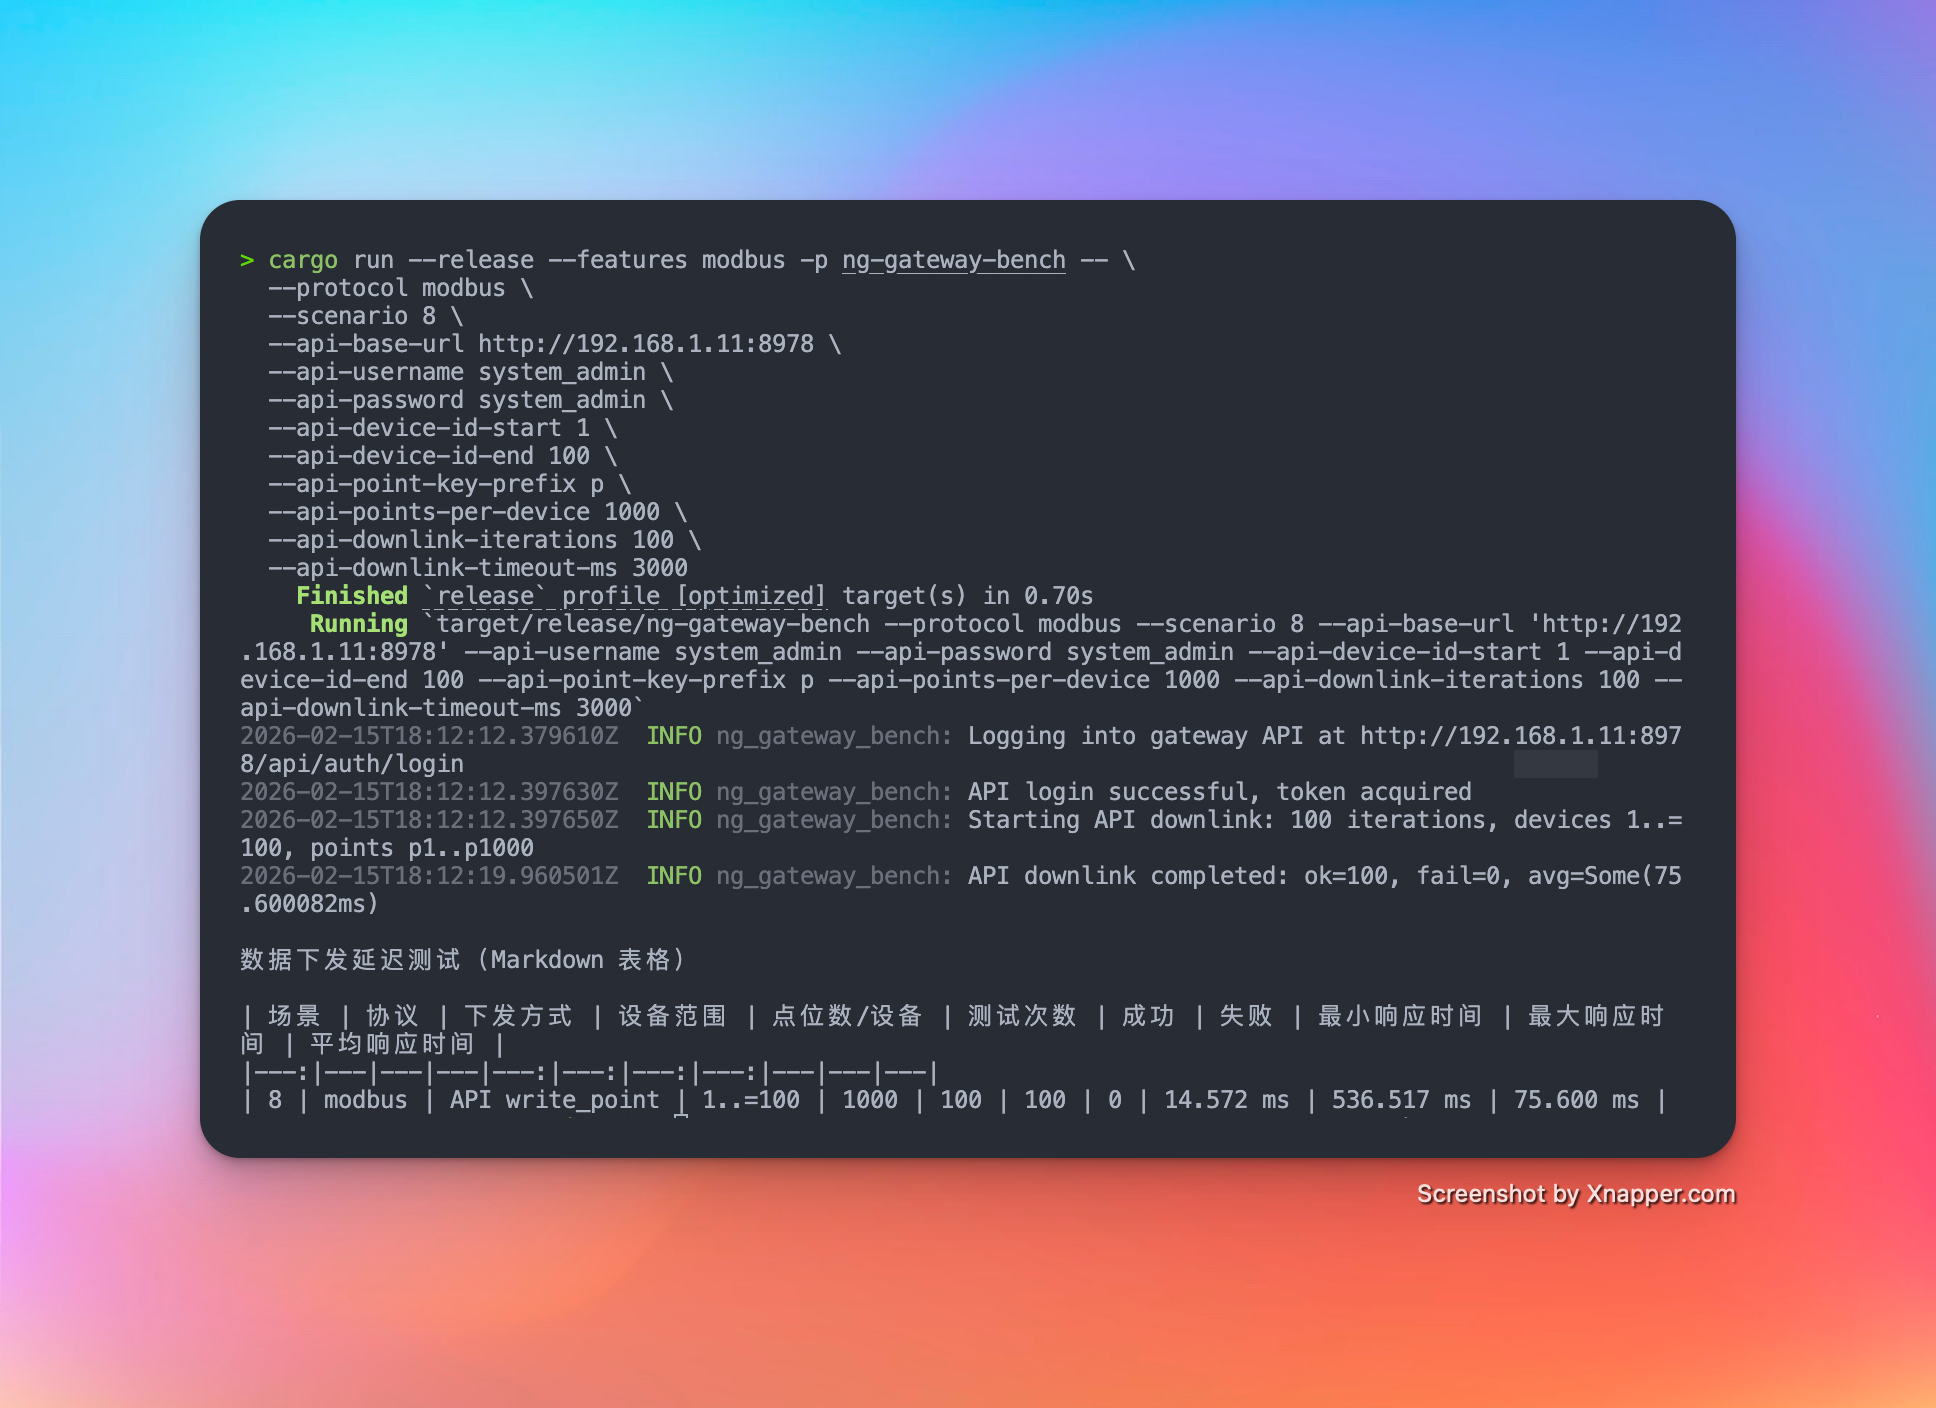
Scenario 7: Mixed Workload (Collection + Downlink)
- Config: 10 Channels · 10 Devices · 1,000 Points/Device · 1000 ms Period (Total 100,000 Points) + Random Command Dispatching
Metrics (Collection)
| Memory | CPU | Network Bandwidth |
|---|---|---|
| 153 MiB | 7.03% | rx: 542.0 kB/s tx: 144.0 kB/s |
Metrics (Downlink)
| Success/Fail | Min Latency | Max Latency | Avg Latency |
|---|---|---|---|
| 100 / 0 | 14.572 ms | 536.517 ms | 75.600 ms |
Resource Monitor Screenshots