Modbus 性能基准测试
本文记录 NG Gateway 对 Modbus TCP 协议的性能基准测试过程与结果。测试在资源受限的 Docker 容器中运行网关(1 CPU / 1 GB 内存),使用外部 Modbus 从站模拟器提供真实协议交互负载,并通过 Prometheus + Grafana + cAdvisor 监控栈实时采集容器级资源指标,系统性评估网关在不同采集规模与频率下的资源占用和运行稳定性。
测试覆盖以下维度:
- 采集规模梯度:从单通道 10 设备(10,000 点位)逐步扩展至 10 通道 100 设备(100,000 点位)
- 采集频率对比:标准周期(1000 ms)与高频采集(100 ms)
- 混合负载压测:大规模数据采集与随机指令下发并发执行
测试环境
硬件平台
| 项目 | 规格 |
|---|---|
| CPU | 4 核 |
| 内存 | 24 GB |
| 操作系统 | Debian GNU/Linux 12 |
网关部署
网关以 docker compose 容器方式部署,并设置资源上限以模拟边缘侧受限运行环境:
| 资源 | 限制(Limit) | 预留(Reservation) |
|---|---|---|
| CPU | 1.0 核 | 0.5 核 |
| 内存 | 1000 MiB | 256 MiB |
TIP
资源约束通过 Docker Compose deploy.resources.limits 配置,与 Kubernetes Pod 资源配额语义一致。
docker-compose.yaml
yaml
services:
  gateway:
    image: ${GATEWAY_IMAGE:-shiyuecamus/ng-gateway}:${GATEWAY_TAG:-latest}
    container_name: ng-gateway
    restart: unless-stopped
    ports:
      - "${GATEWAY_HTTP_PORT:-8978}:5678"
      - "${GATEWAY_WS_PORT:-8979}:5679"
    volumes:
      - gateway-data:/app/data
      - gateway-drivers:/app/drivers/custom
      - gateway-plugins:/app/plugins/custom
    deploy:
      resources:
        limits:
          cpus: "${BENCH_CPU_LIMIT:-1.0}"
          memory: "${BENCH_MEM_LIMIT:-1000M}"
        reservations:
          cpus: "${BENCH_CPU_RESERVE:-0.5}"
          memory: "${BENCH_MEM_RESERVE:-256M}"

  cadvisor:
    image: gcr.io/cadvisor/cadvisor:v0.51.0
    container_name: ng-cadvisor
    restart: unless-stopped
    ports:
      - "8080:8080"
    command:
      - --docker_only=true
      - --housekeeping_interval=2s
      - --store_container_labels=true
    volumes:
      - /:/rootfs:ro
      - /var/run:/var/run:ro
      - /var/run/docker.sock:/var/run/docker.sock:rw
      - /sys:/sys:ro
      - /sys/fs/cgroup:/sys/fs/cgroup:ro
      - /var/lib/docker/:/var/lib/docker:ro
      - /dev/disk/:/dev/disk:ro
    privileged: true
    devices:
      - /dev/kmsg:/dev/kmsg

  prometheus:
    image: prom/prometheus:latest
    container_name: ng-prometheus
    restart: unless-stopped
    ports:
      - "9090:9090"
    volumes:
      - ./prometheus/prometheus.yml:/etc/prometheus/prometheus.yml:ro
      - ng-prometheus-data:/prometheus
    command:
      - --config.file=/etc/prometheus/prometheus.yml
      - --storage.tsdb.path=/prometheus
      - --web.enable-lifecycle
    depends_on:
      - cadvisor
      - gateway

  grafana:
    image: grafana/grafana:latest
    container_name: ng-grafana
    restart: unless-stopped
    ports:
      - "3000:3000"
    environment:
      GF_SECURITY_ADMIN_USER: admin
      GF_SECURITY_ADMIN_PASSWORD: admin
      GF_USERS_ALLOW_SIGN_UP: "false"
      GF_PATHS_PROVISIONING: /etc/grafana/provisioning
    volumes:
      - ./grafana/provisioning:/etc/grafana/provisioning:ro
      - ./grafana/dashboards:/var/lib/grafana/dashboards:ro
      - ng-grafana-data:/var/lib/grafana
    depends_on:
      - prometheus

volumes:
  ng-prometheus-data:
  ng-grafana-data:
  gateway-data:
  gateway-drivers:
  gateway-plugins:
测试工具
Modbus 从站模拟器
使用 Modbus Slave(Witte Software 出品)作为 Modbus TCP 从站模拟器。Modbus Slave 是一款广泛应用于工业自动化领域的商业级仿真工具,支持 Modbus TCP / RTU / ASCII 协议,能够同时模拟多个独立的从站实例,并提供灵活的寄存器类型配置、数据自动递增和随机化等仿真能力,适用于驱动开发调试与性能压测场景。
模拟拓扑配置:
| 项目 | 配置 |
|---|---|
| 独立 TCP 连接数 | 10 个(监听端口 500 ~ 509) |
| 每连接从站数 | 10 个(Slave ID 1 ~ 10) |
| 模拟从站总数 | 100 个 |
映射关系说明
- 每个 TCP 端口对应
ng-gateway中的一个采集通道(Channel) — 即一条独立的 Modbus TCP 连接 - 每个 Slave ID 对应通道内的一个采集设备(Device) — 通过功能码轮询不同从站地址
- 测试场景按需连接部分或全部端口,以构建从 10,000 到 100,000 点位的不同规模采集负载
性能监控栈
测试期间的资源指标采集采用 cAdvisor + Prometheus + Grafana 组合,整套监控栈与网关容器通过同一 docker compose 文件统一编排:
| 组件 | 版本 | 职责 |
|---|---|---|
| cAdvisor | v0.51.0 | 采集容器级资源指标:CPU 使用率、内存(RSS / Cache)、网络收发字节数 |
| Prometheus | latest | 每 2s 抓取 cAdvisor /metrics 端点,持久化时序数据 |
| Grafana | latest | 可视化面板,预配置 cAdvisor Docker 容器监控仪表盘 |
采集的核心指标:
| 指标 | Prometheus Metric | 说明 |
|---|---|---|
| CPU 使用率 | container_cpu_usage_seconds_total | 按容器维度计算 CPU 使用百分比 |
| 内存占用 | container_memory_rss | 常驻内存集(Resident Set Size) |
| 网络接收 | container_network_receive_bytes_total | 容器网络接收字节总量(计算速率) |
| 网络发送 | container_network_transmit_bytes_total | 容器网络发送字节总量(计算速率) |
快速启动:
bash
cd deploy/compose/bench && docker compose up -d| 服务 | 访问地址 |
|---|---|
| Grafana | http://localhost:3000(admin / admin) |
| Prometheus | http://localhost:9090 |
| cAdvisor | http://localhost:8080 |
| ng-gateway | http://localhost:8978 |
结果汇总
数据采集性能表
| 场景 | 通道数 | 设备数/通道 | 点位数/设备 | 采集频率 | 总计点位 | 点位类型 | 内存 | CPU | 网络带宽消耗 |
|---|---|---|---|---|---|---|---|---|---|
| 1 | 1 | 10 | 1,000 | 1000 ms | 10,000 | Float32 | 50.8 MiB | 2.62% | rx: 55.2 kB/s tx: 14 kB/s |
| 2 | 5 | 10 | 1,000 | 1000 ms | 50,000 | Float32 | 103 MiB | 4.41% | rx: 269.0 kB/s tx: 72.0 kB/s |
| 3 | 10 | 10 | 1,000 | 1000 ms | 100,000 | Float32 | 153 MiB | 7.03% | rx: 542.0 kB/s tx: 144.0 kB/s |
| 4 | 1 | 1 | 1,000 | 100 ms | 1,000 | Float32 | 44.8 MiB | 2.60% | rx: 47.8 kB/s tx: 13.5 kB/s |
| 5 | 5 | 1 | 1,000 | 100 ms | 5,000 | Float32 | 50.9 MiB | 4.61% | rx: 265.0 kB/s tx: 87.3 kB/s |
| 6 | 10 | 1 | 1,000 | 100 ms | 10,000 | Float32 | 55.2 MiB | 7.56% | rx: 530.0 kB/s tx: 173.0 kB/s |
| 7 | 10 | 10 | 1,000 | 1000 ms | 100,000 | Float32 | 153 MiB | 7.03% | rx: 542.0 kB/s tx: 144.0 kB/s |
混合负载性能表
| 场景 | 通道数 | 设备数/通道 | 点位数/设备 | 采集频率 | 总计点位 | 点位类型 | 下发方式 | 下发点位数 | 测试次数 | 最小响应时间 | 最大响应时间 | 平均响应时间 |
|---|---|---|---|---|---|---|---|---|---|---|---|---|
| 7 | 10 | 10 | 1,000 | 1000 ms | 100,000 | Float32 | API | 100 | 100 | 14.572 ms | 536.517 ms | 75.600 ms |
测试场景与结果详情
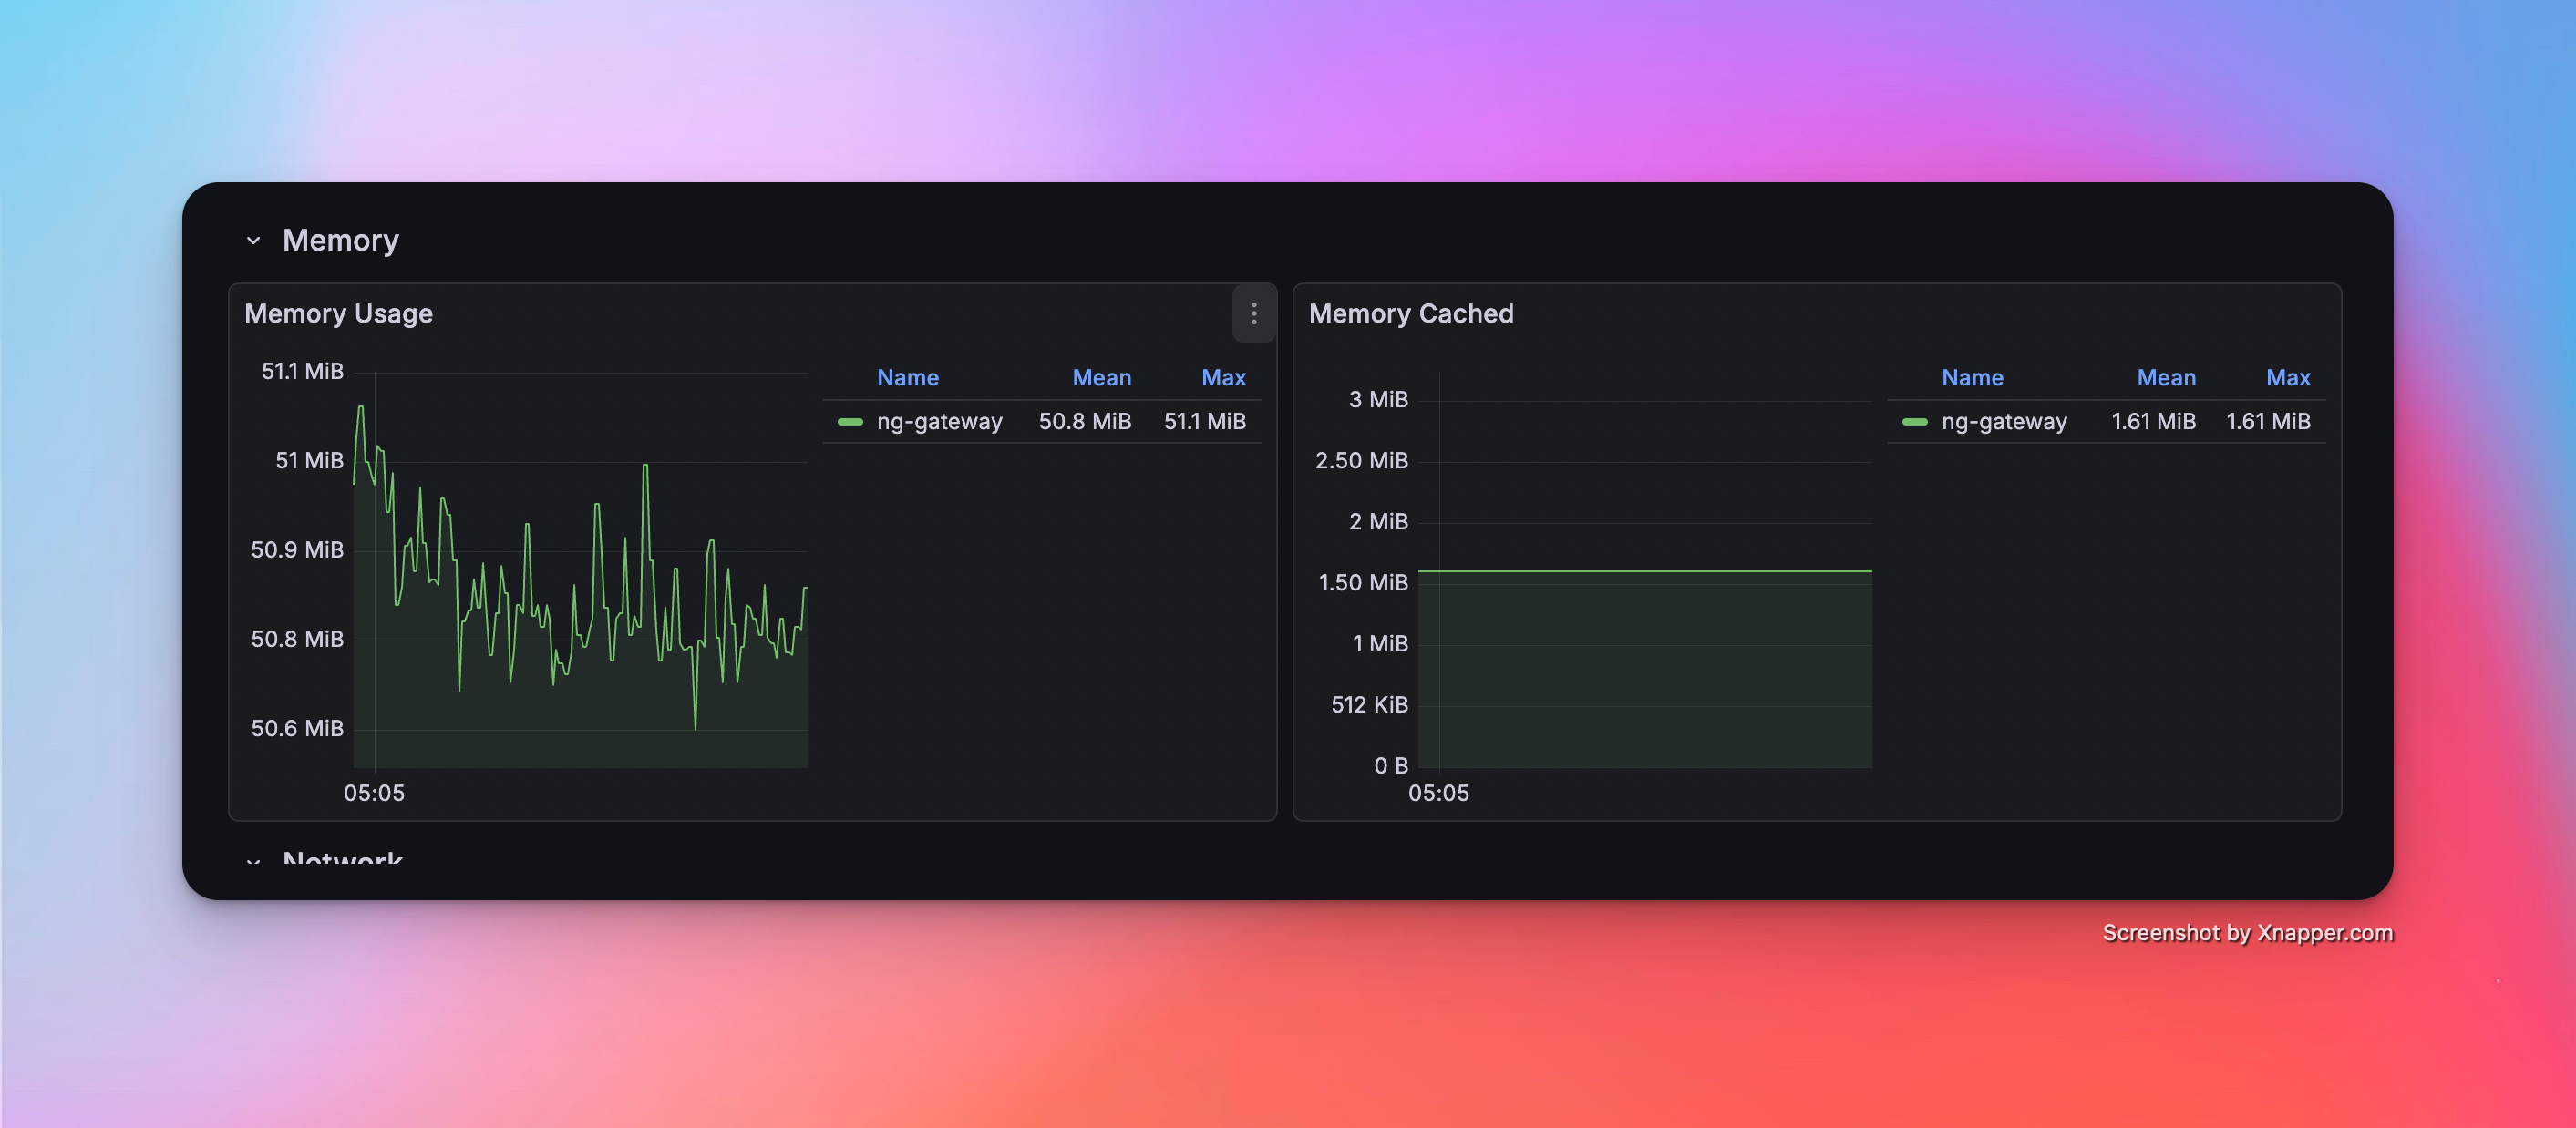
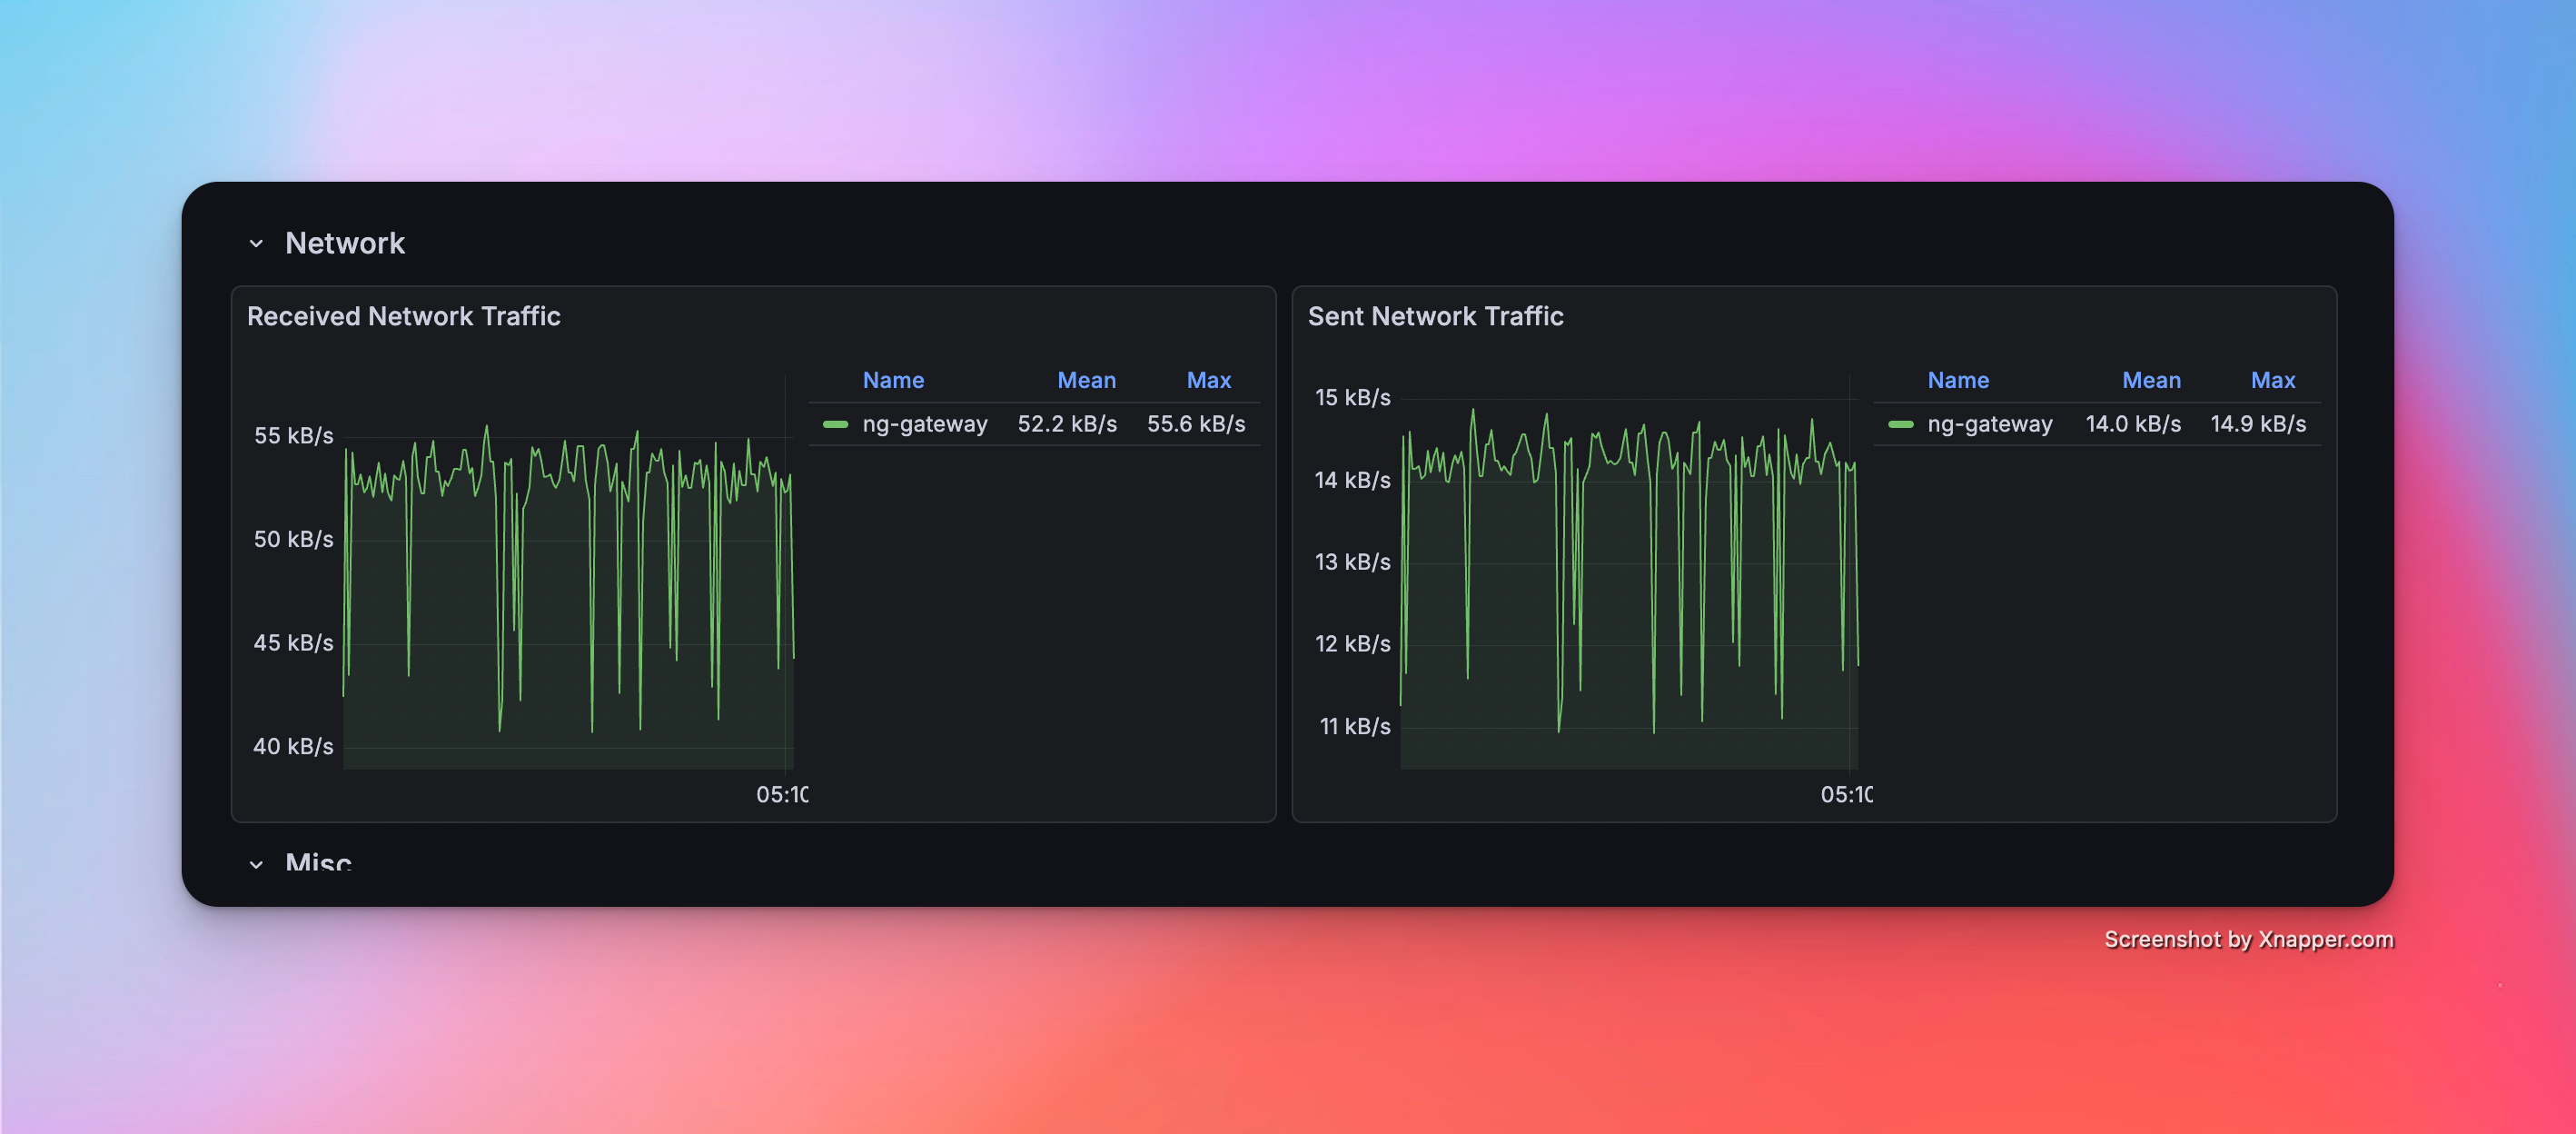
场景 1:基础采集
- 配置:1 通道 · 10 设备 · 1,000 点位/设备 · 1000 ms 周期(总计 10,000 点位)
性能指标
| 内存 | CPU | 网络带宽消耗 |
|---|---|---|
| 50.8 MiB | 2.62% | rx: 55.2 kB/s tx: 14 kB/s |
资源监控截图

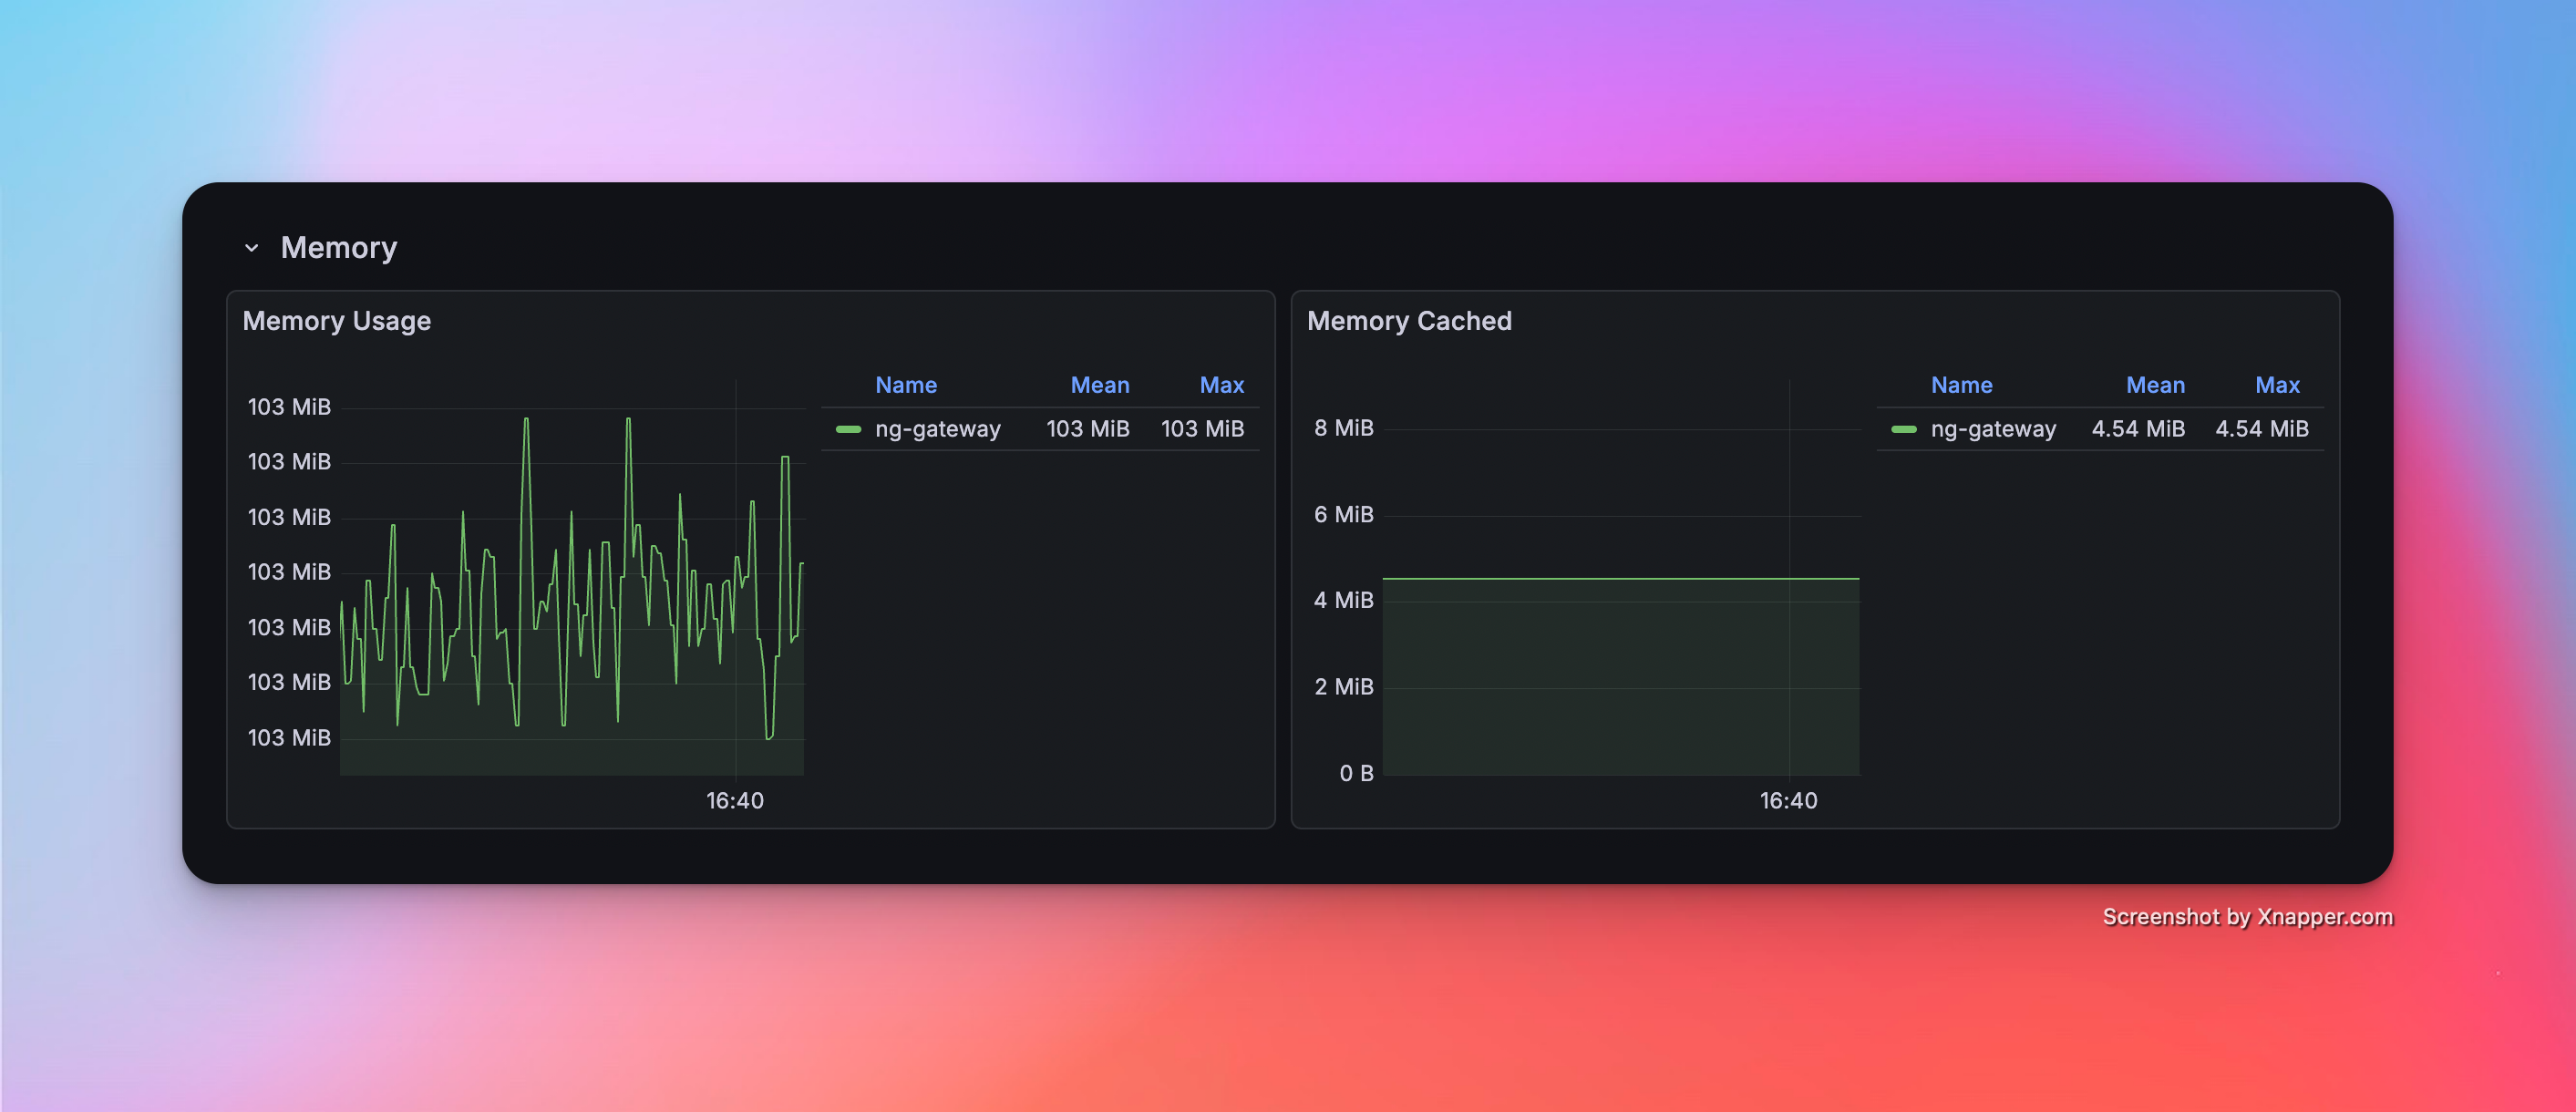
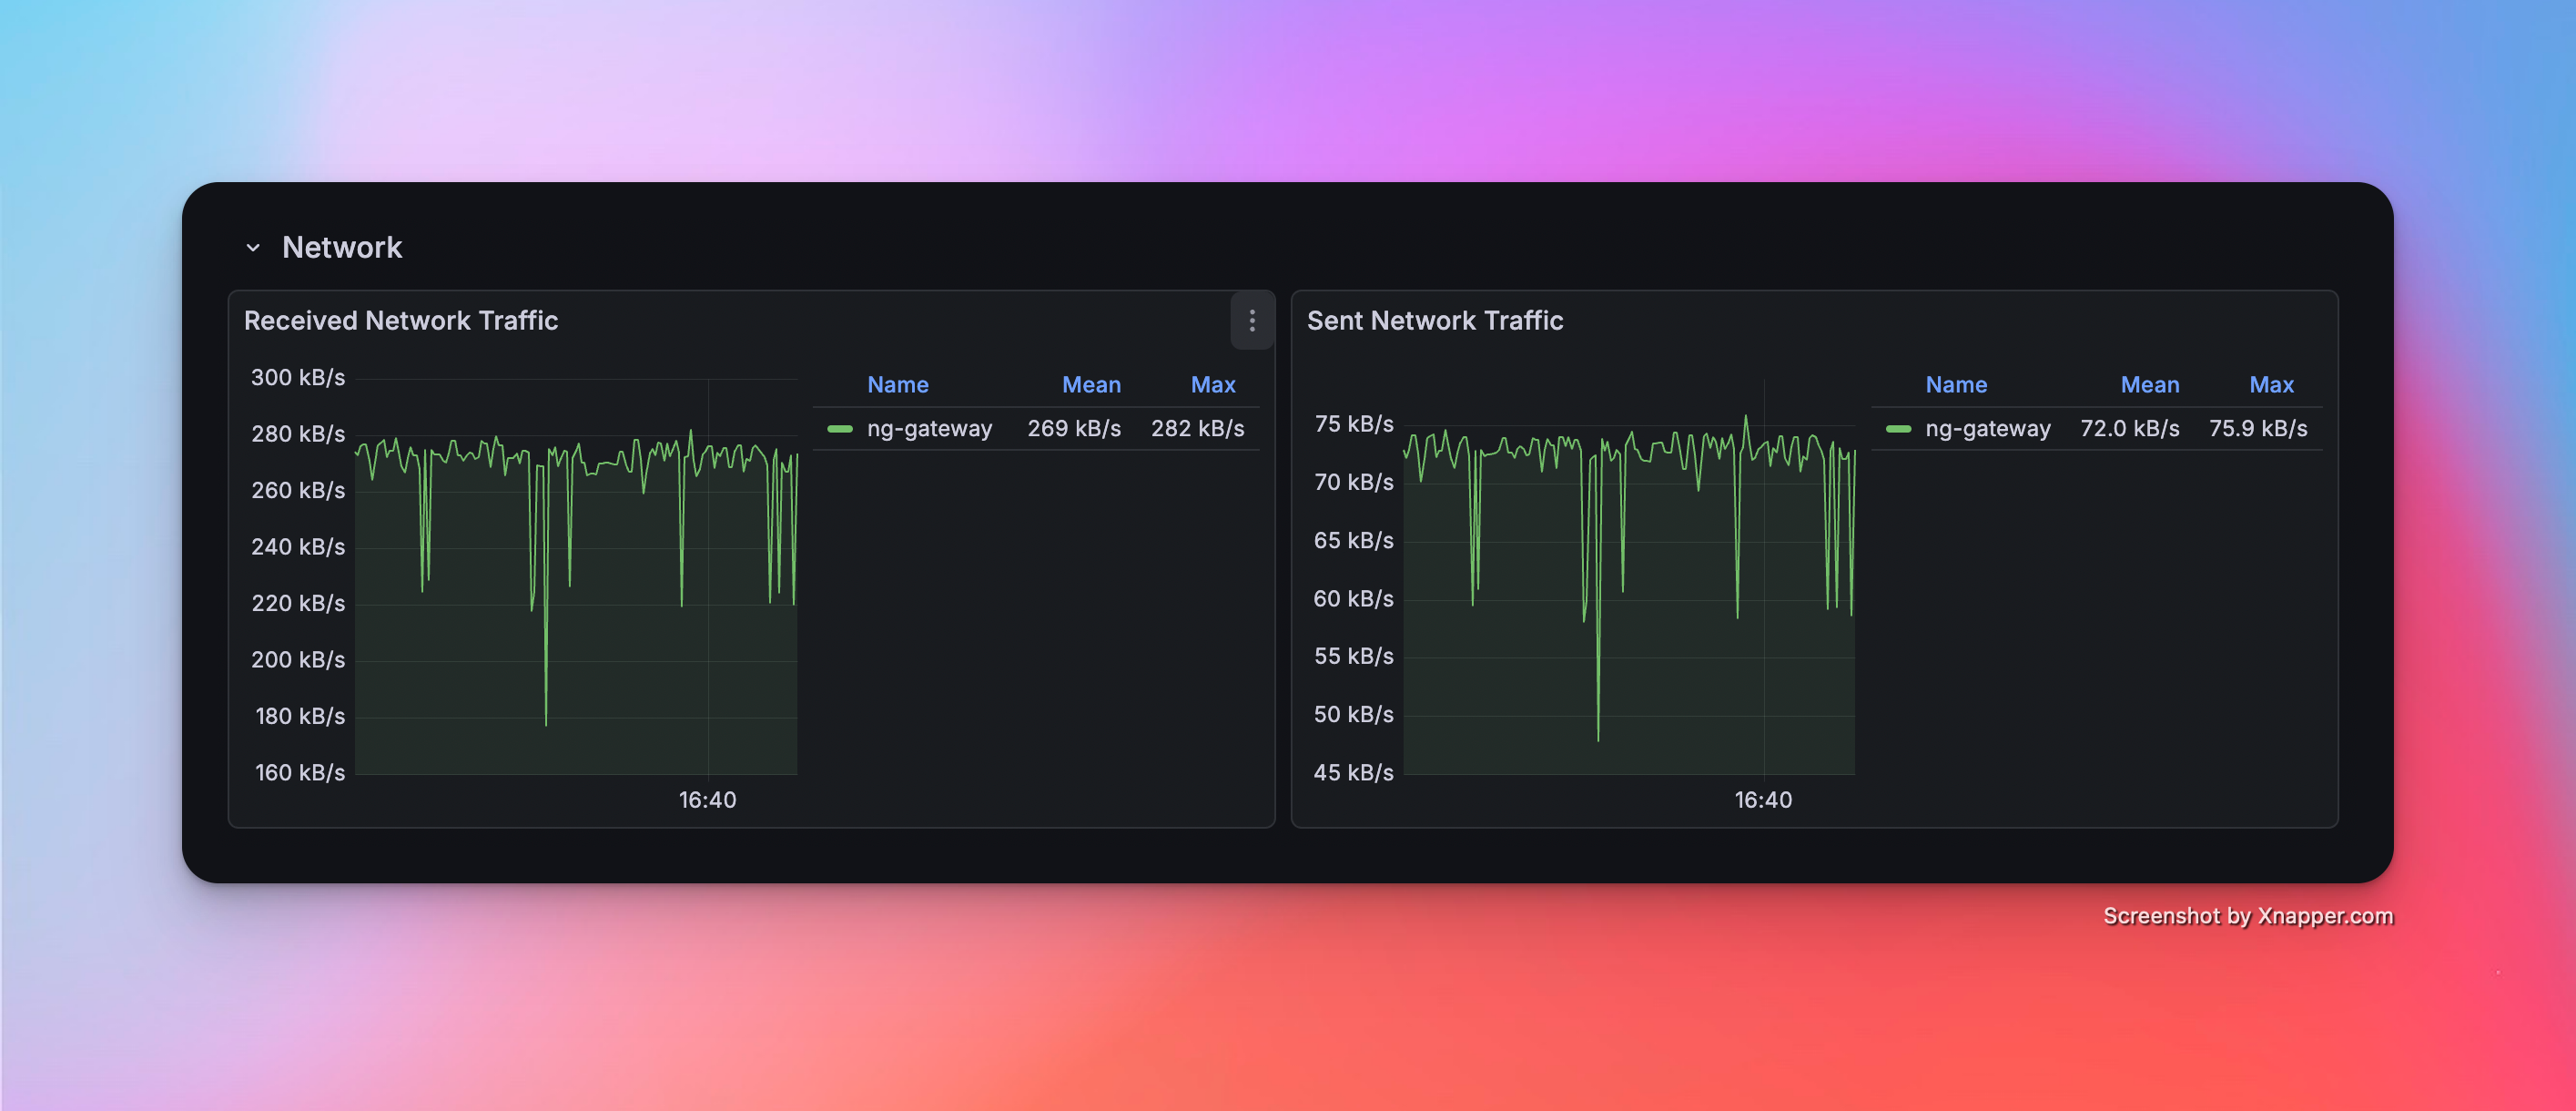
场景 2:中等规模采集
- 配置:5 通道 · 10 设备 · 1,000 点位/设备 · 1000 ms 周期(总计 50,000 点位)
性能指标
| 内存 | CPU | 网络带宽消耗 |
|---|---|---|
| 103 MiB | 4.41% | rx: 269.0 kB/s tx: 72.0 kB/s |
资源监控截图

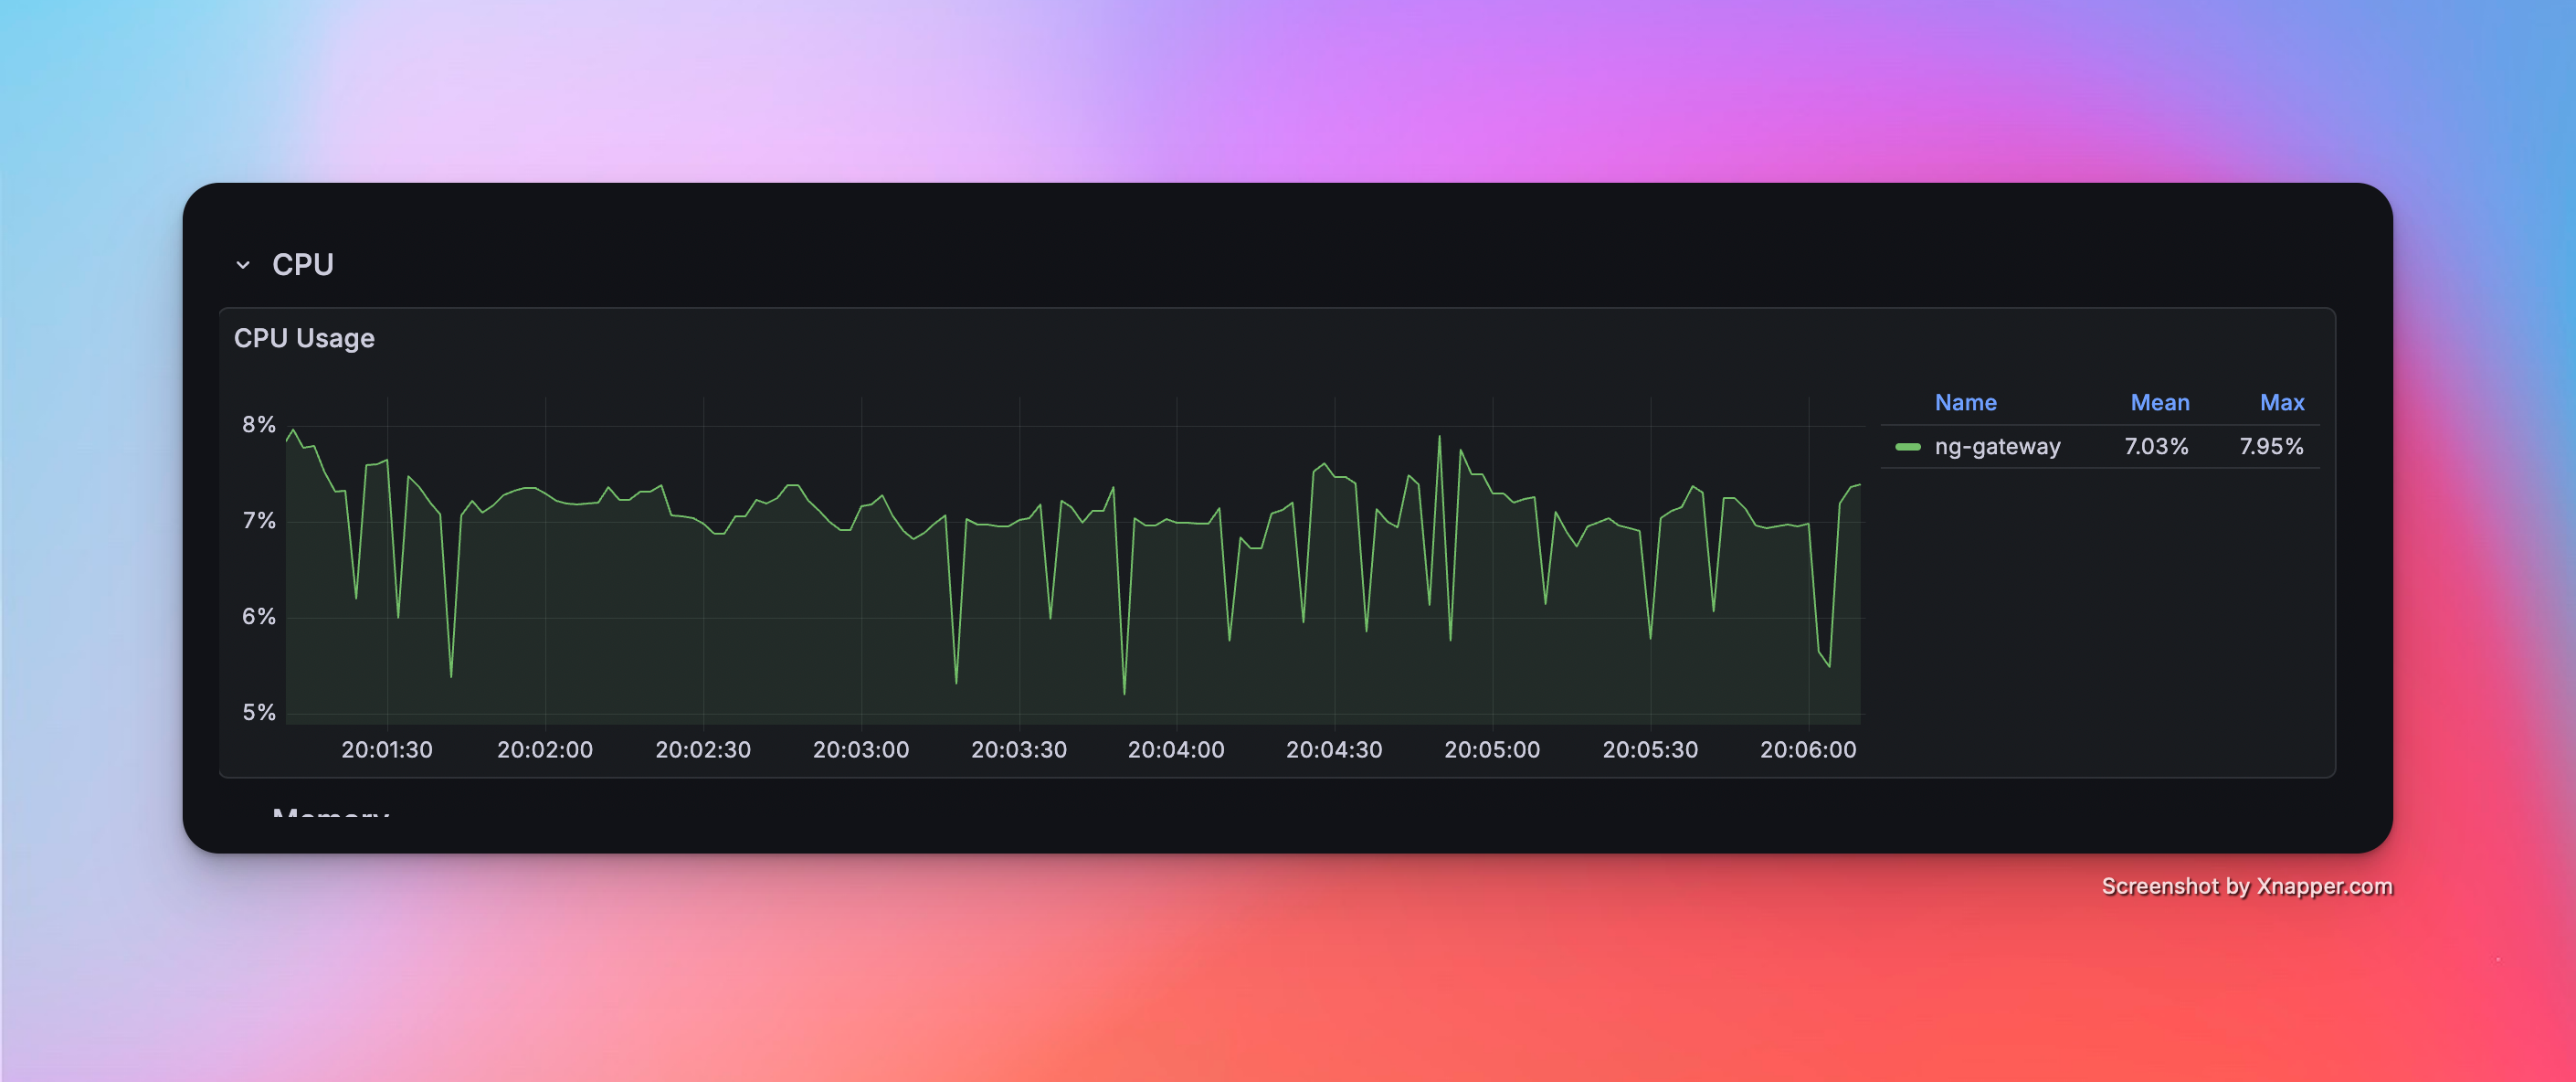
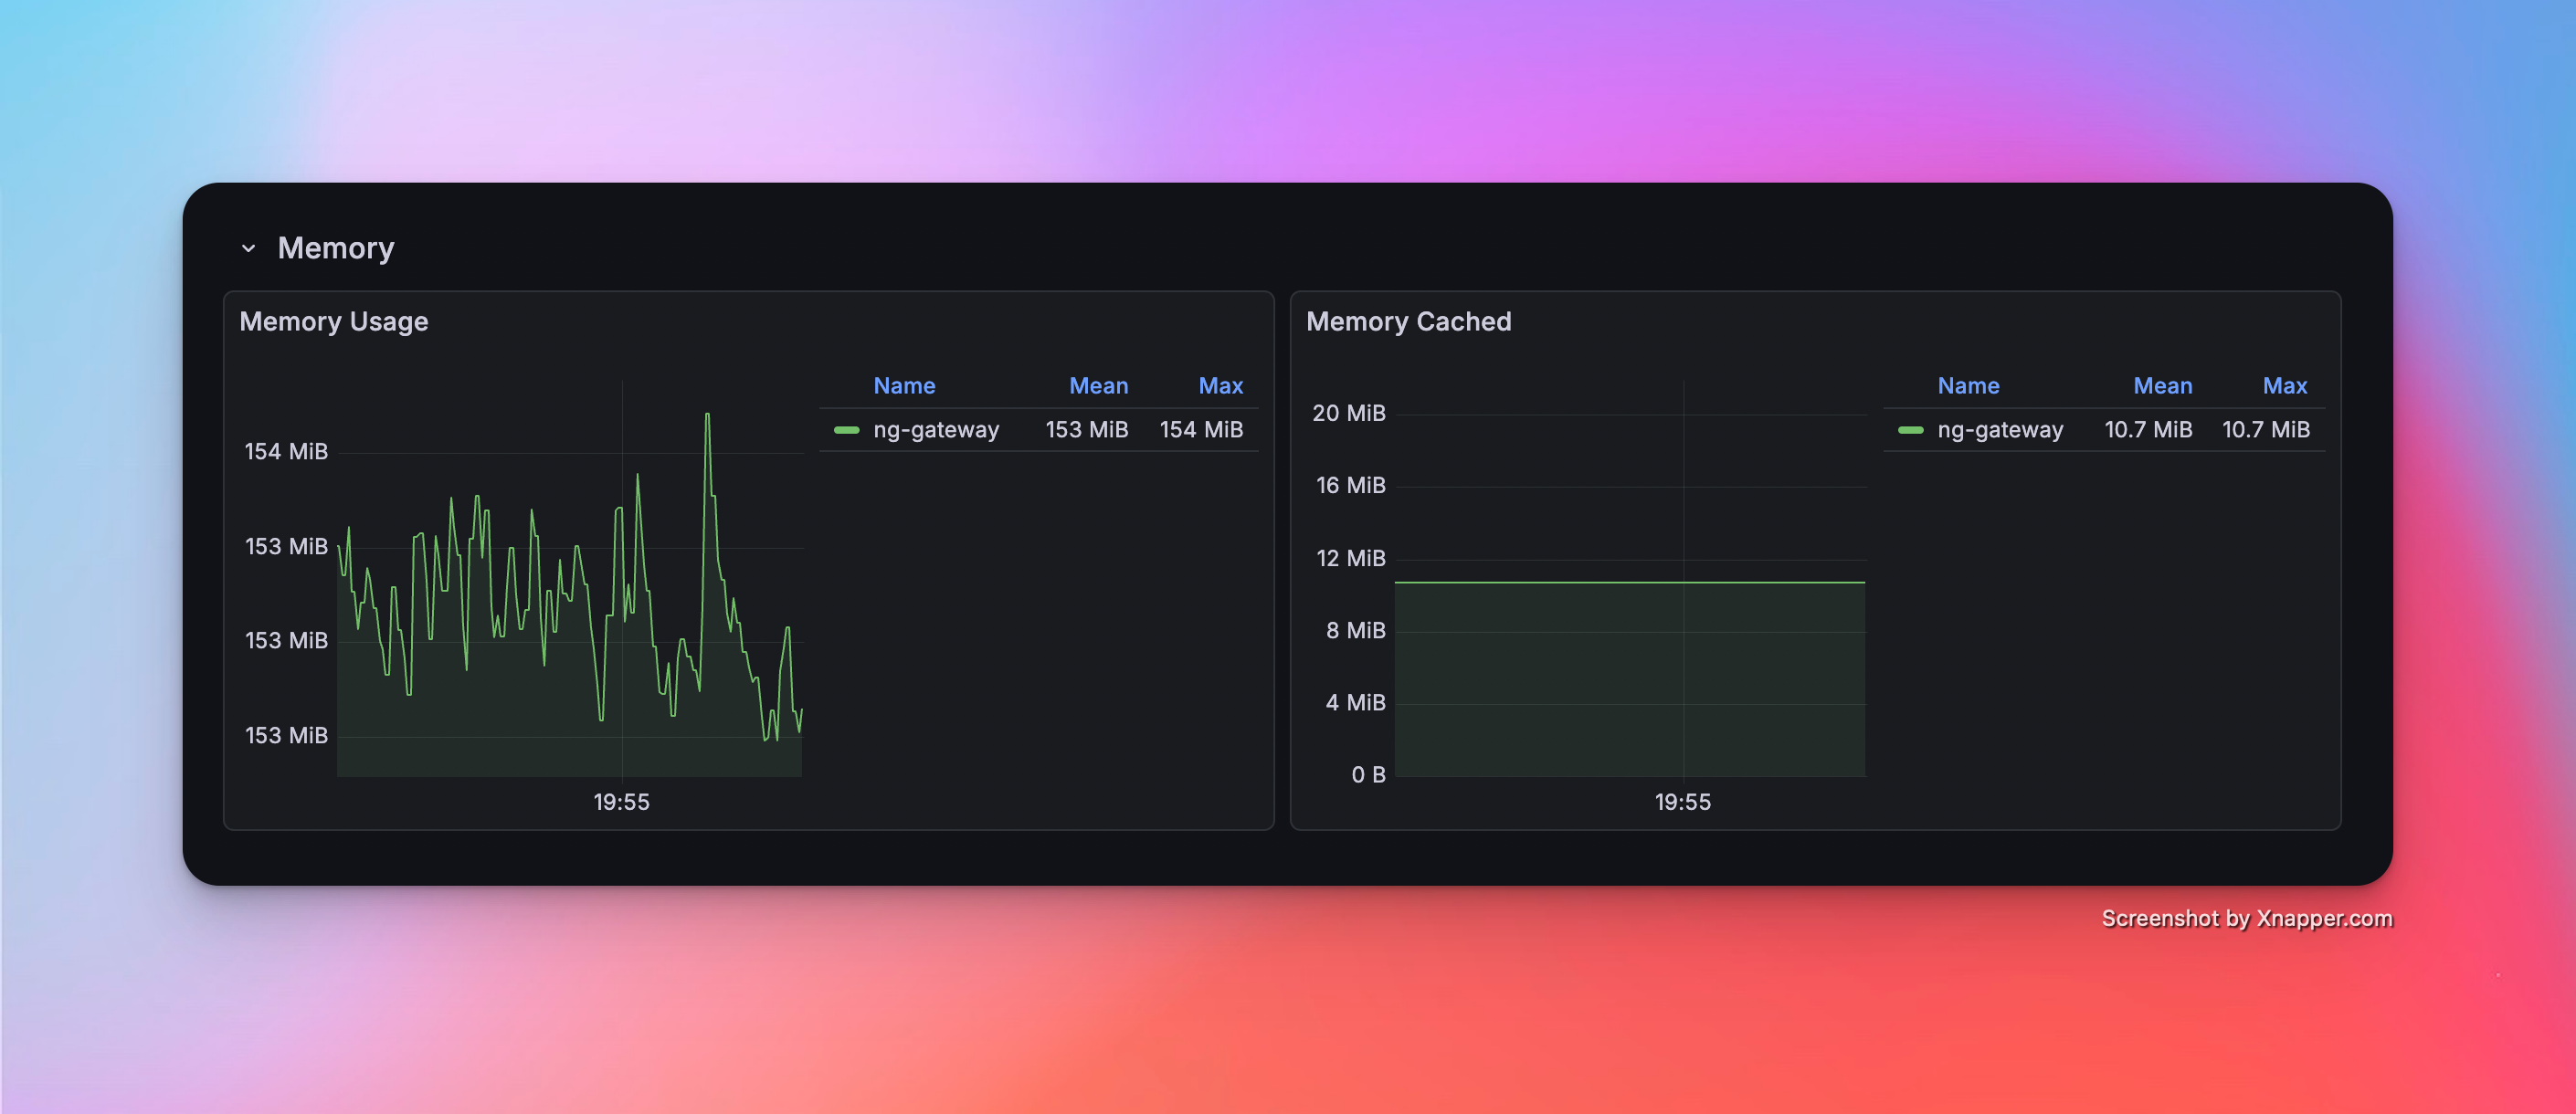
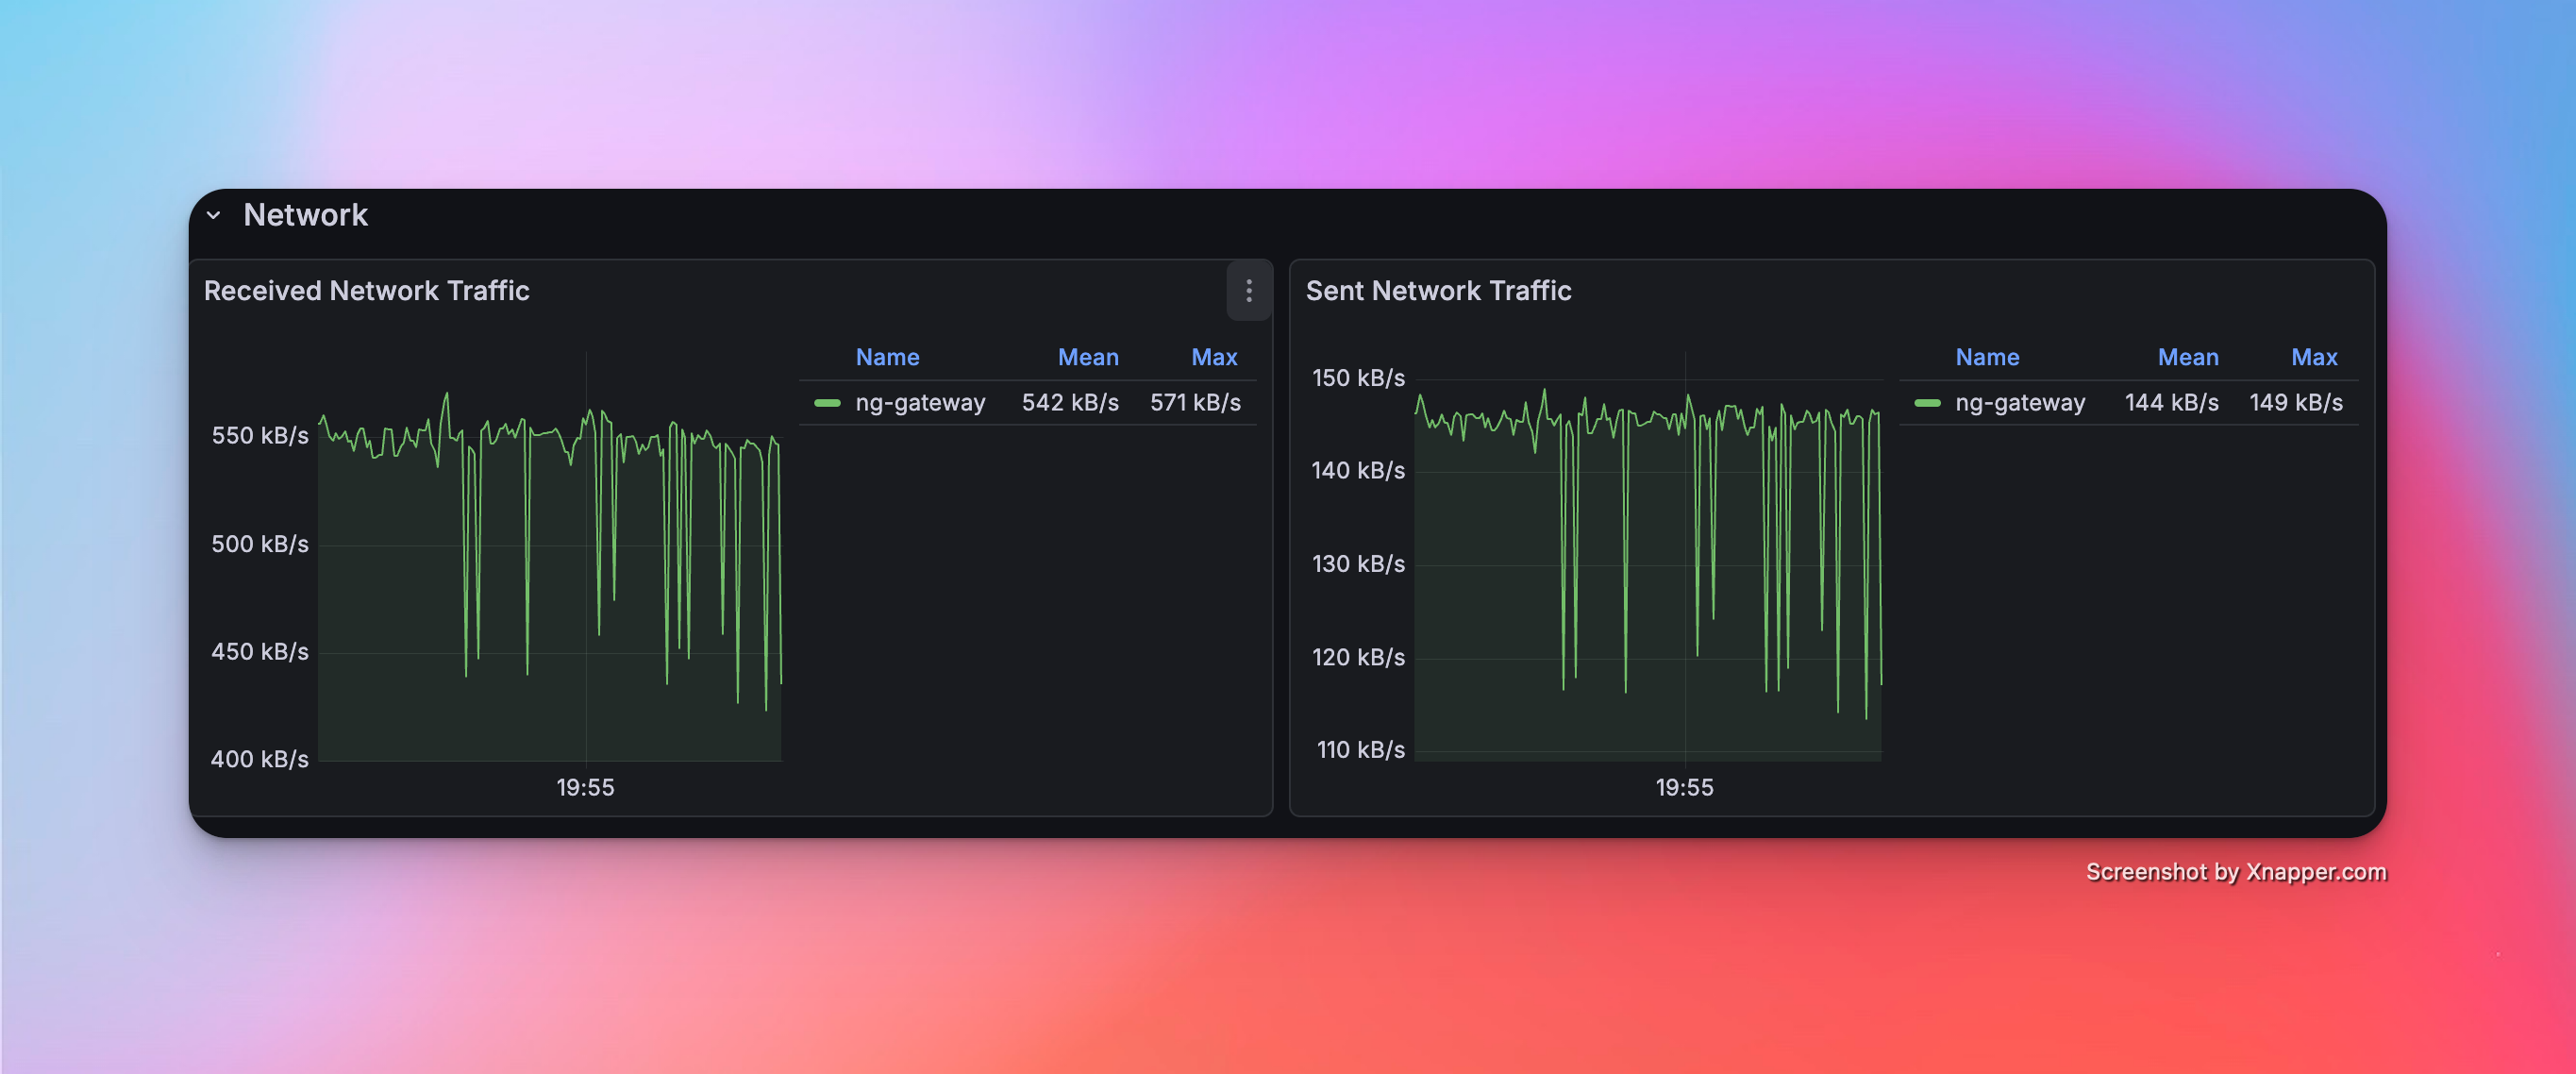
场景 3:大规模采集
- 配置:10 通道 · 10 设备 · 1,000 点位/设备 · 1000 ms 周期(总计 100,000 点位)
性能指标
| 内存 | CPU | 网络带宽消耗 |
|---|---|---|
| 153 MiB | 7.03% | rx: 542.0 kB/s tx: 144.0 kB/s |
资源监控截图
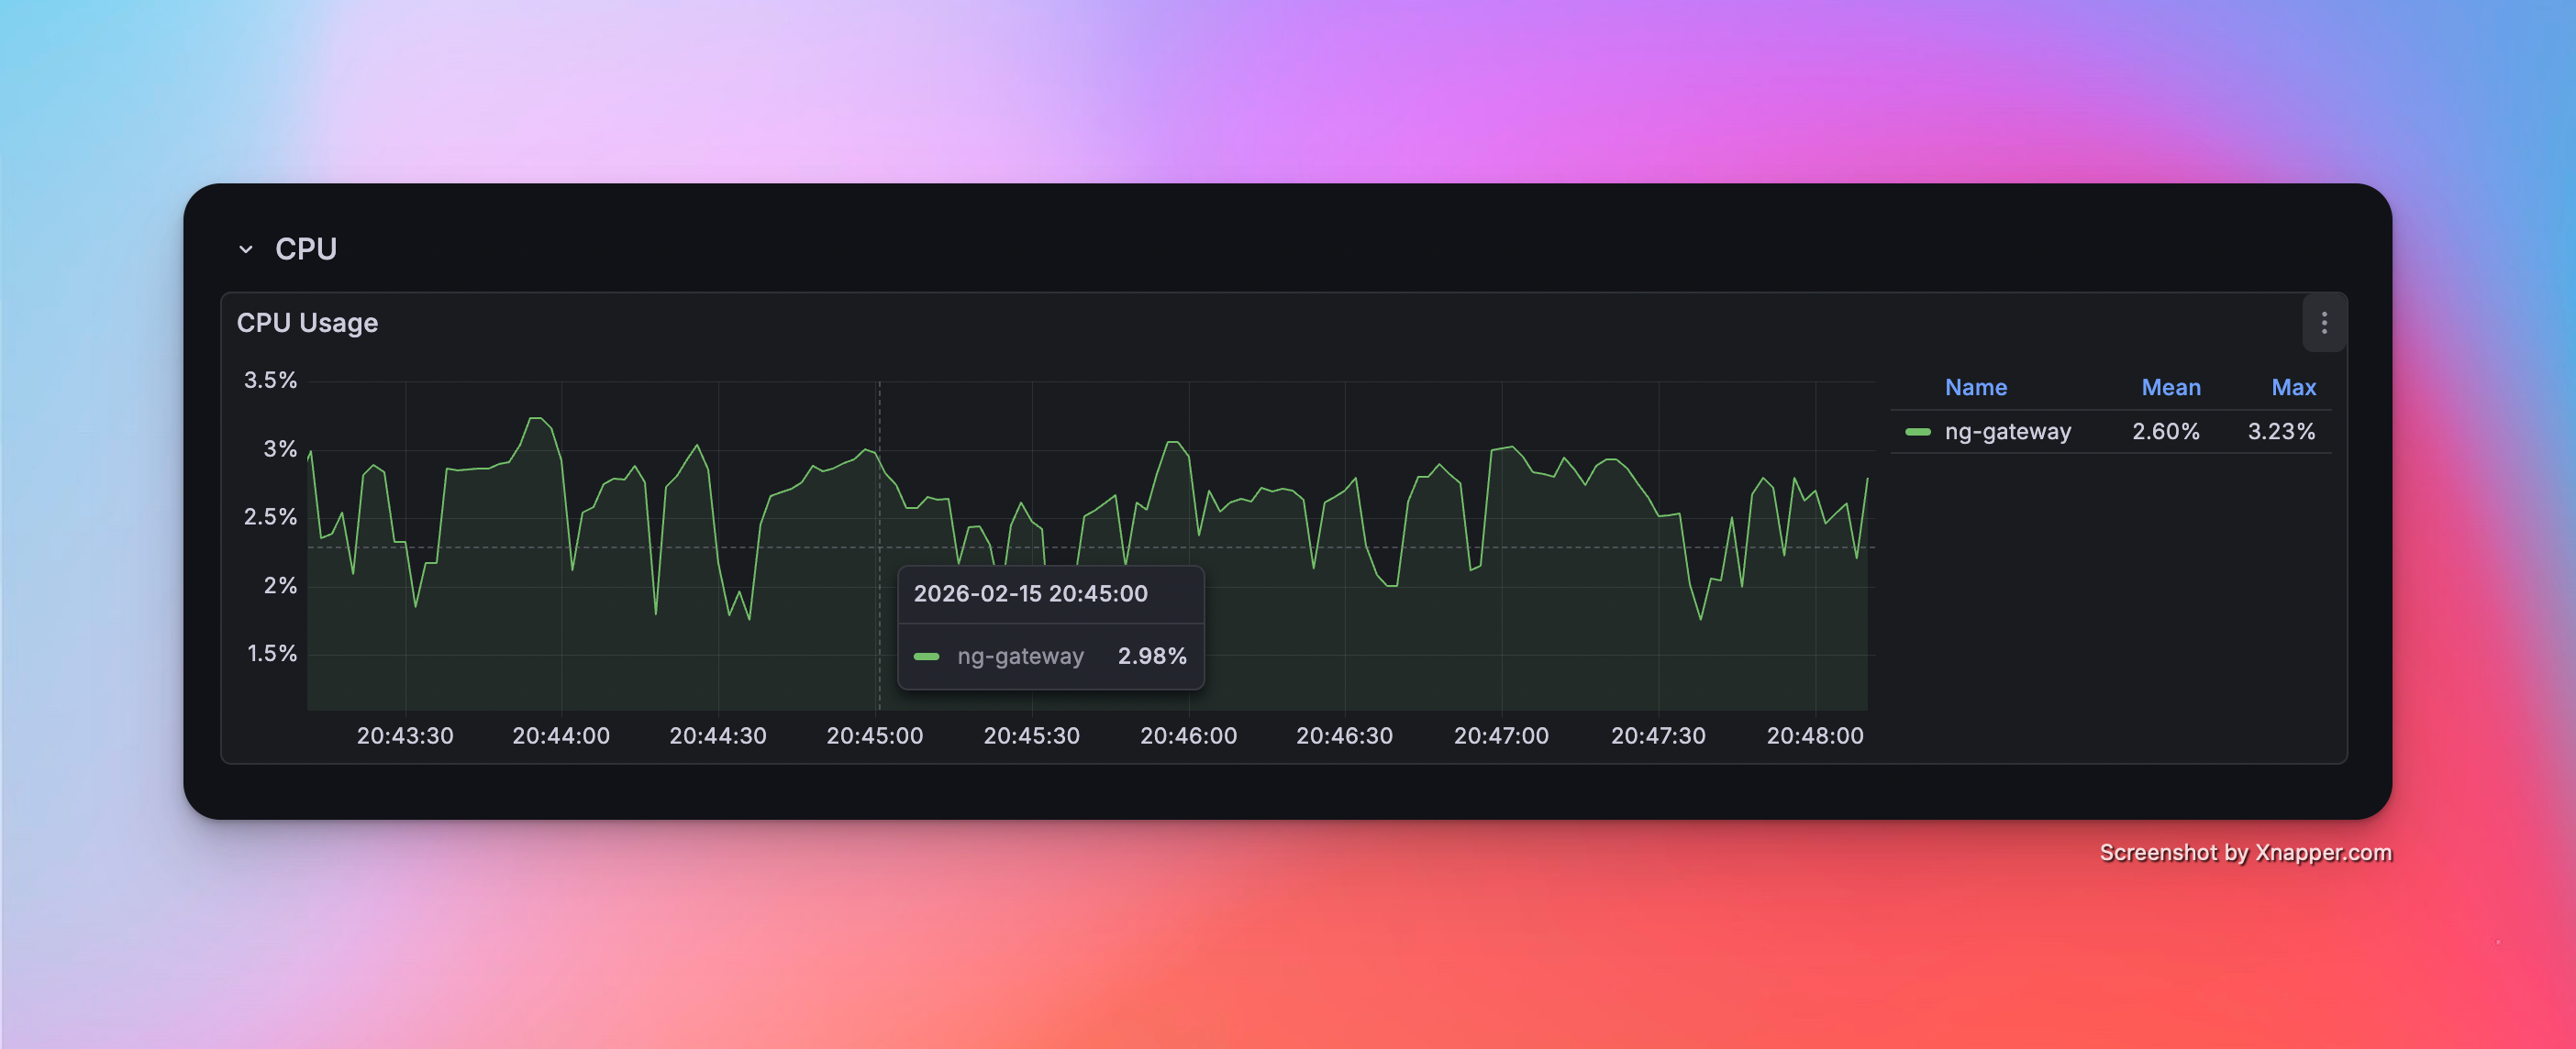
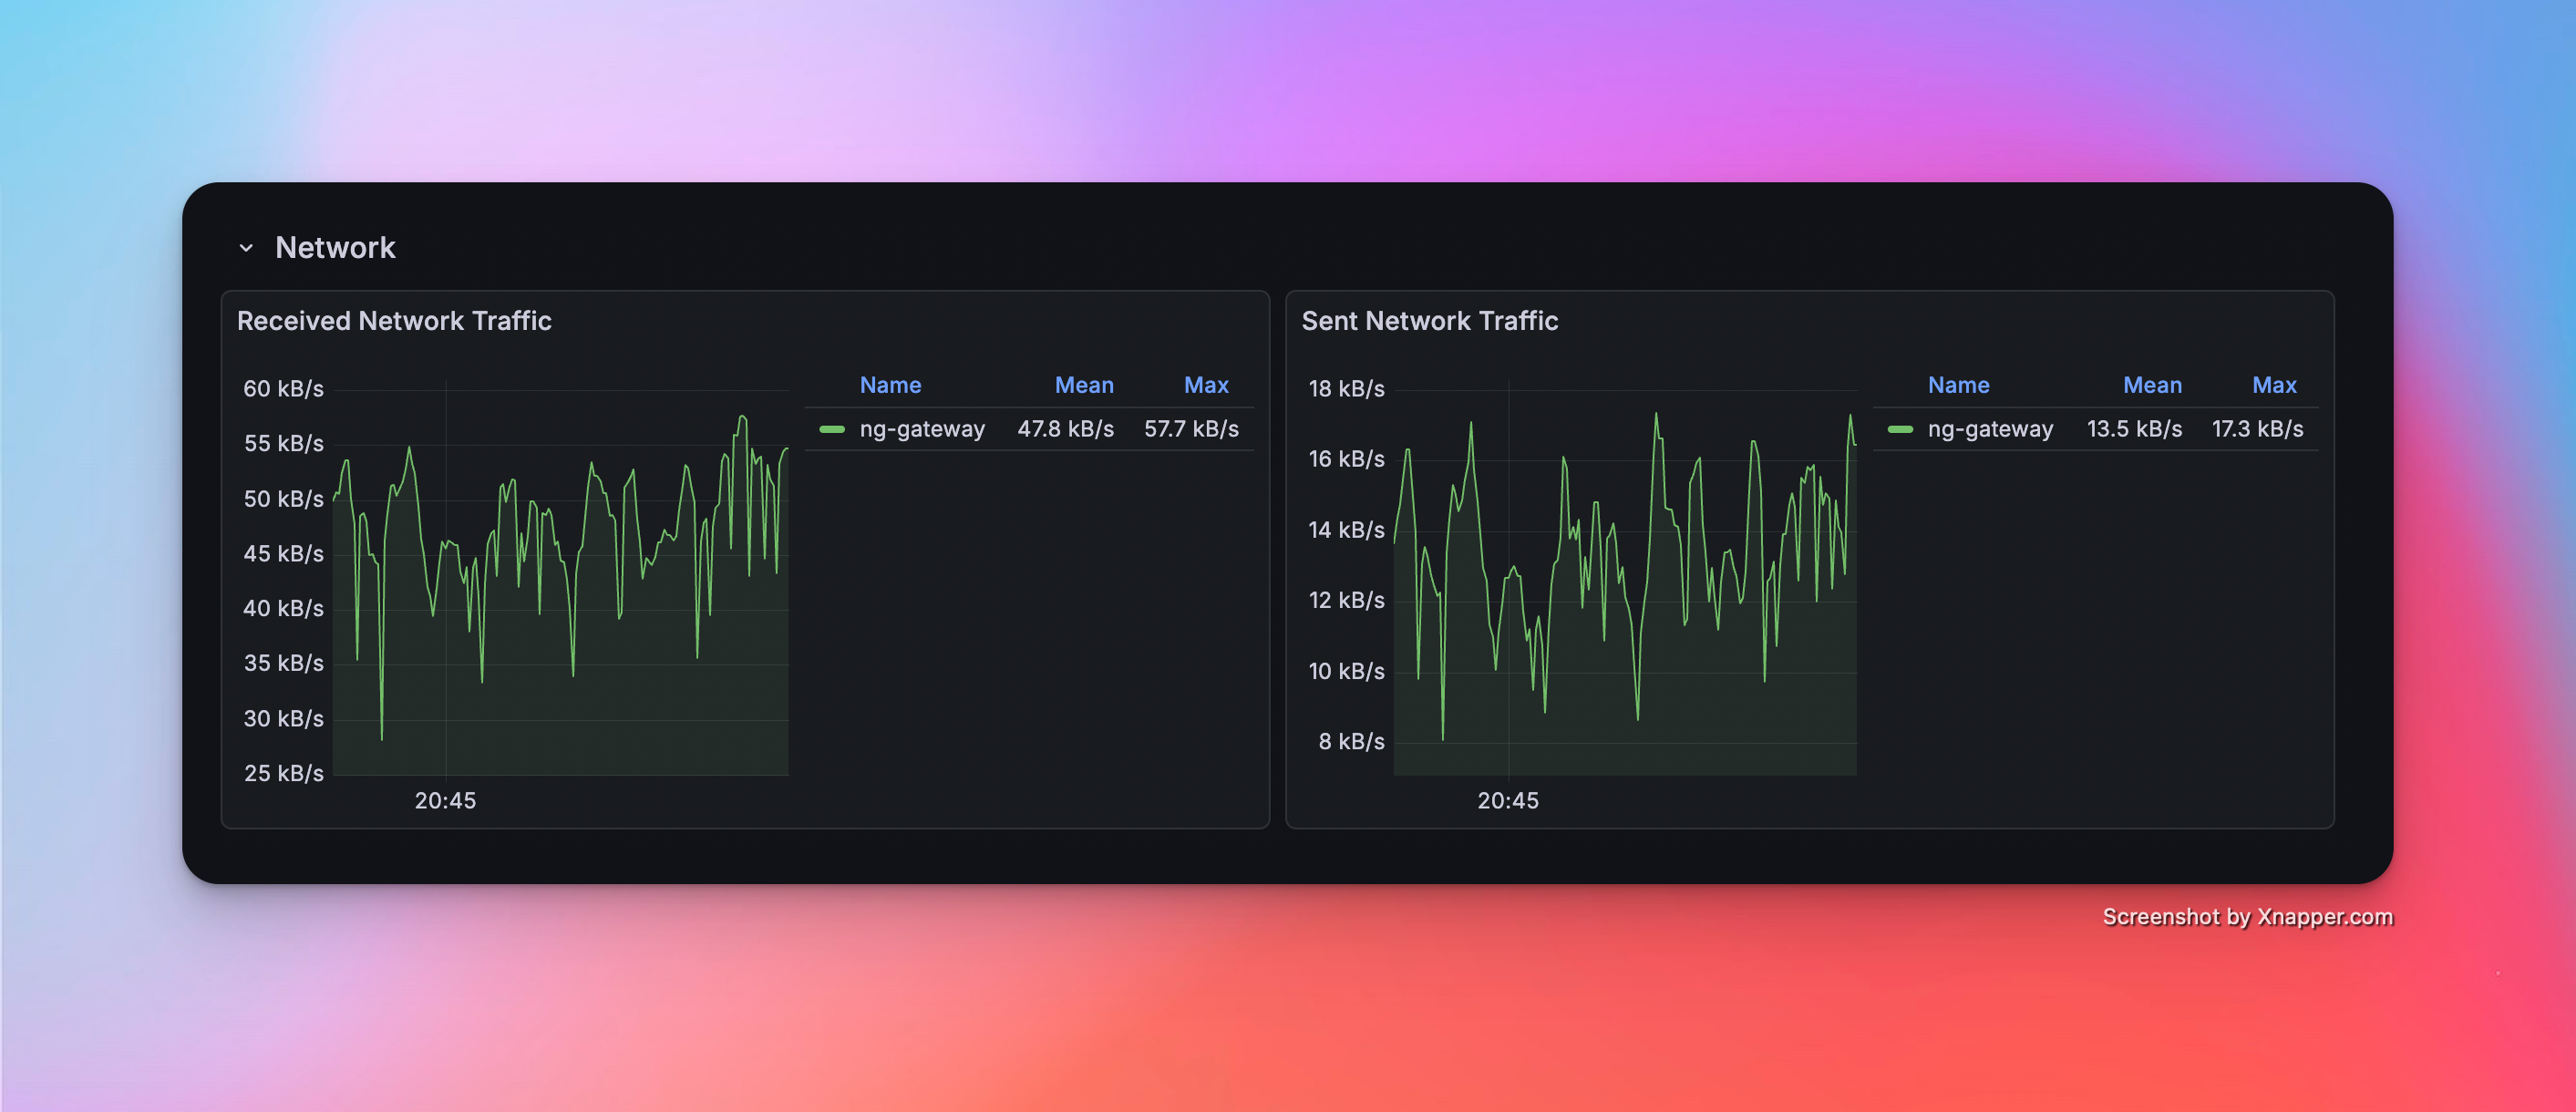
场景 4:高频采集(单通道)
- 配置:1 通道 · 1 设备 · 1,000 点位/设备 · 100 ms 周期(总计 1,000 点位)
性能指标
| 内存 | CPU | 网络带宽消耗 |
|---|---|---|
| 44.8 MiB | 2.60% | rx: 47.8 kB/s tx: 13.5 kB/s |
资源监控截图

场景 5:高频采集(多通道)
- 配置:5 通道 · 1 设备 · 1,000 点位/设备 · 100 ms 周期(总计 5,000 点位)
性能指标
| 内存 | CPU | 网络带宽消耗 |
|---|---|---|
| 50.9 MiB | 4.61% | rx: 265.0 kB/s tx: 87.3 kB/s |
资源监控截图

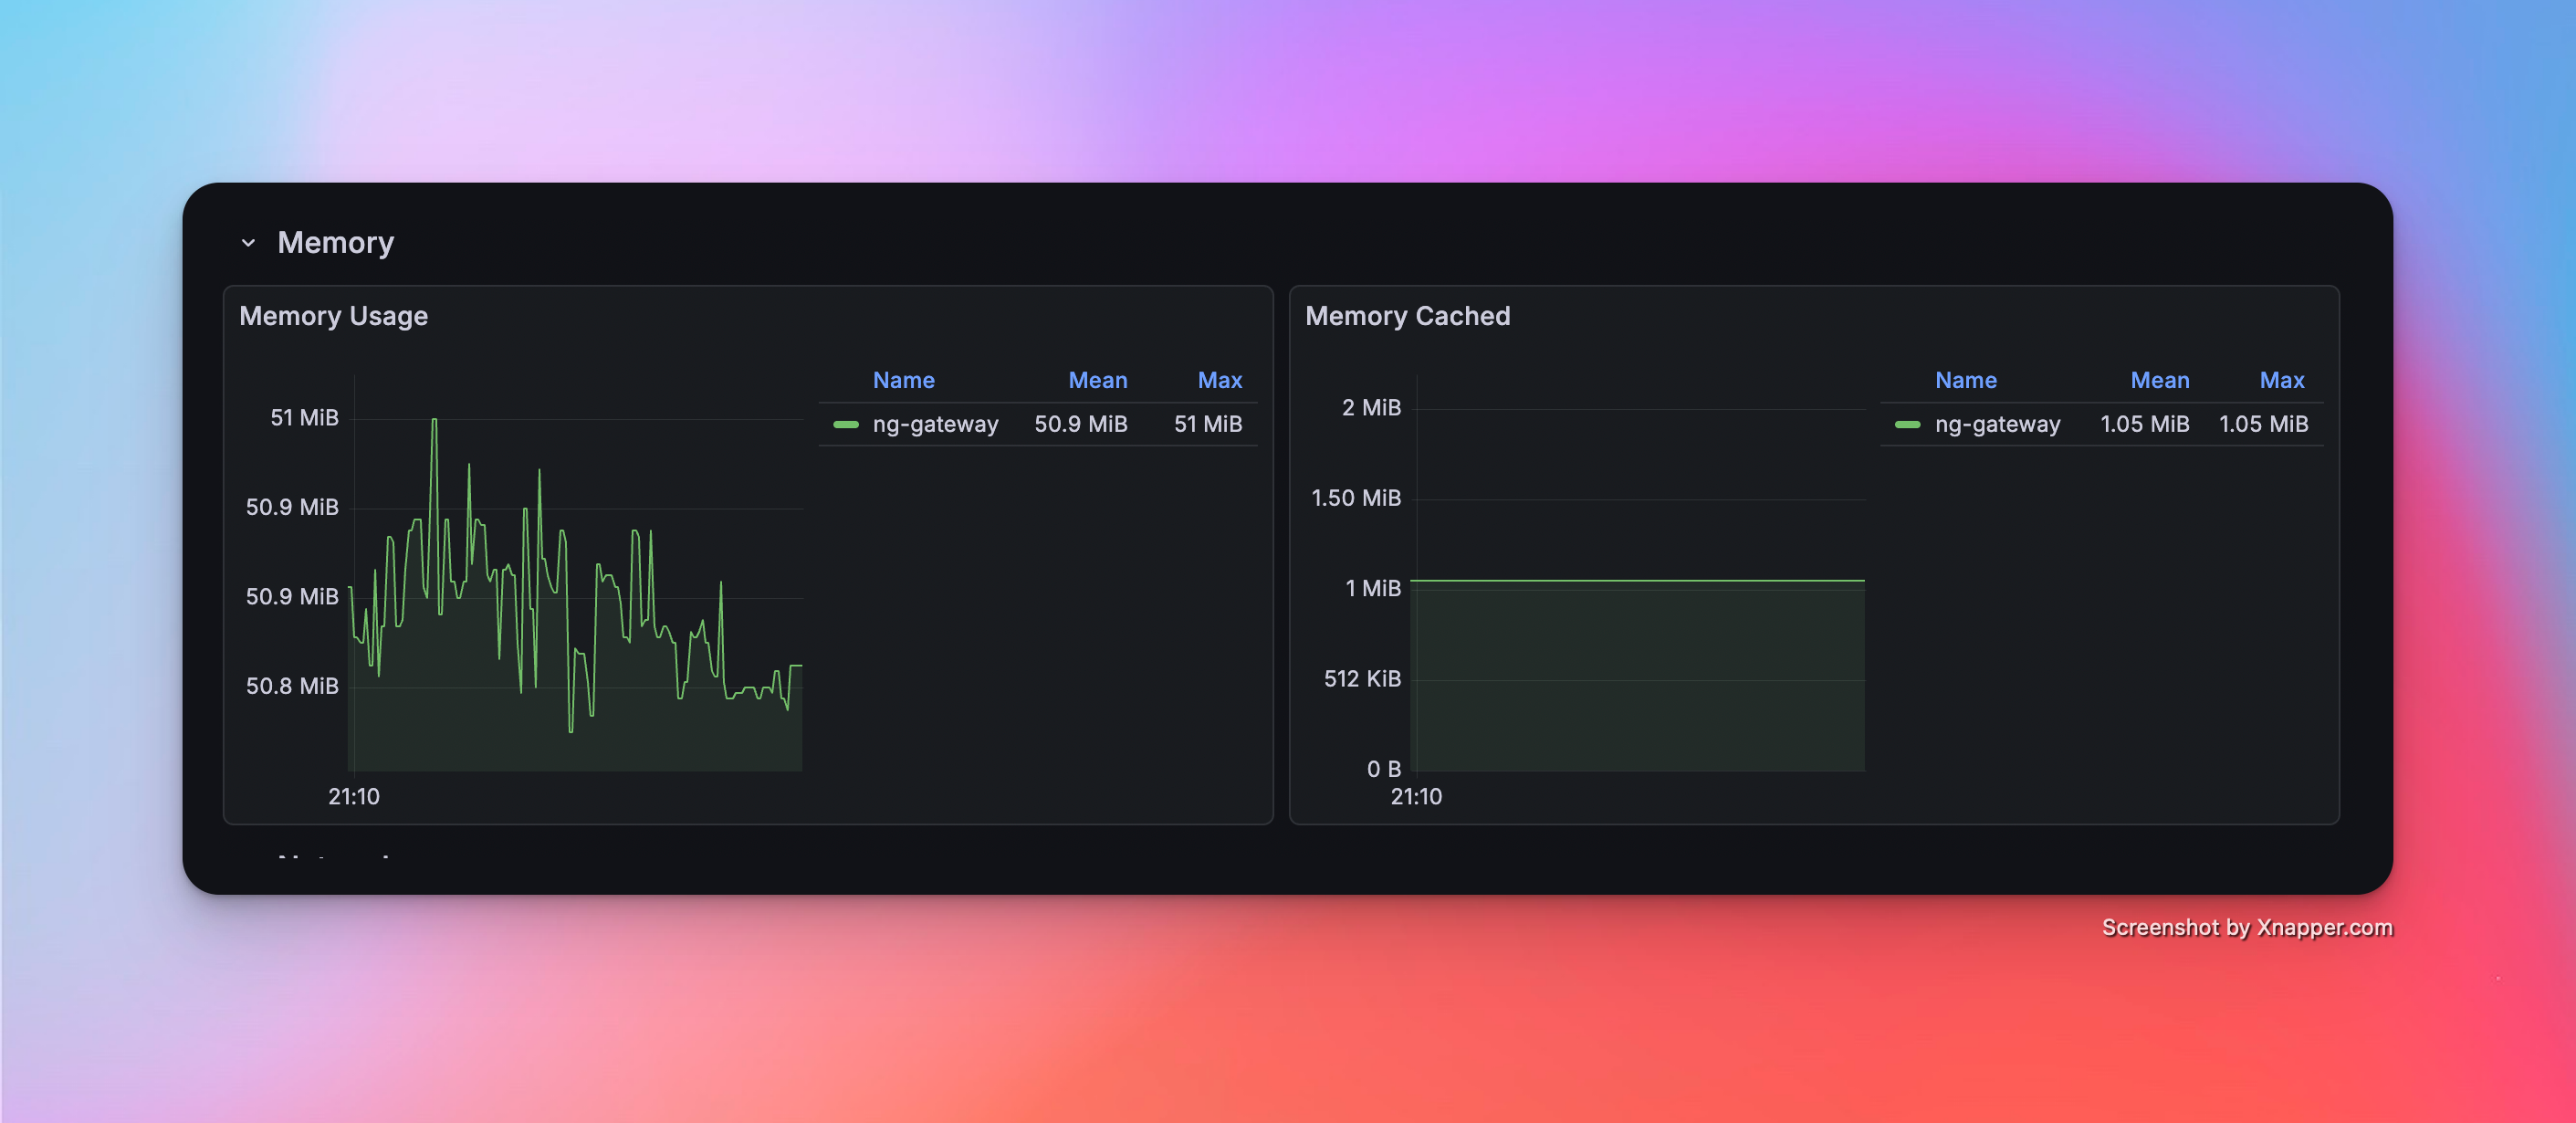
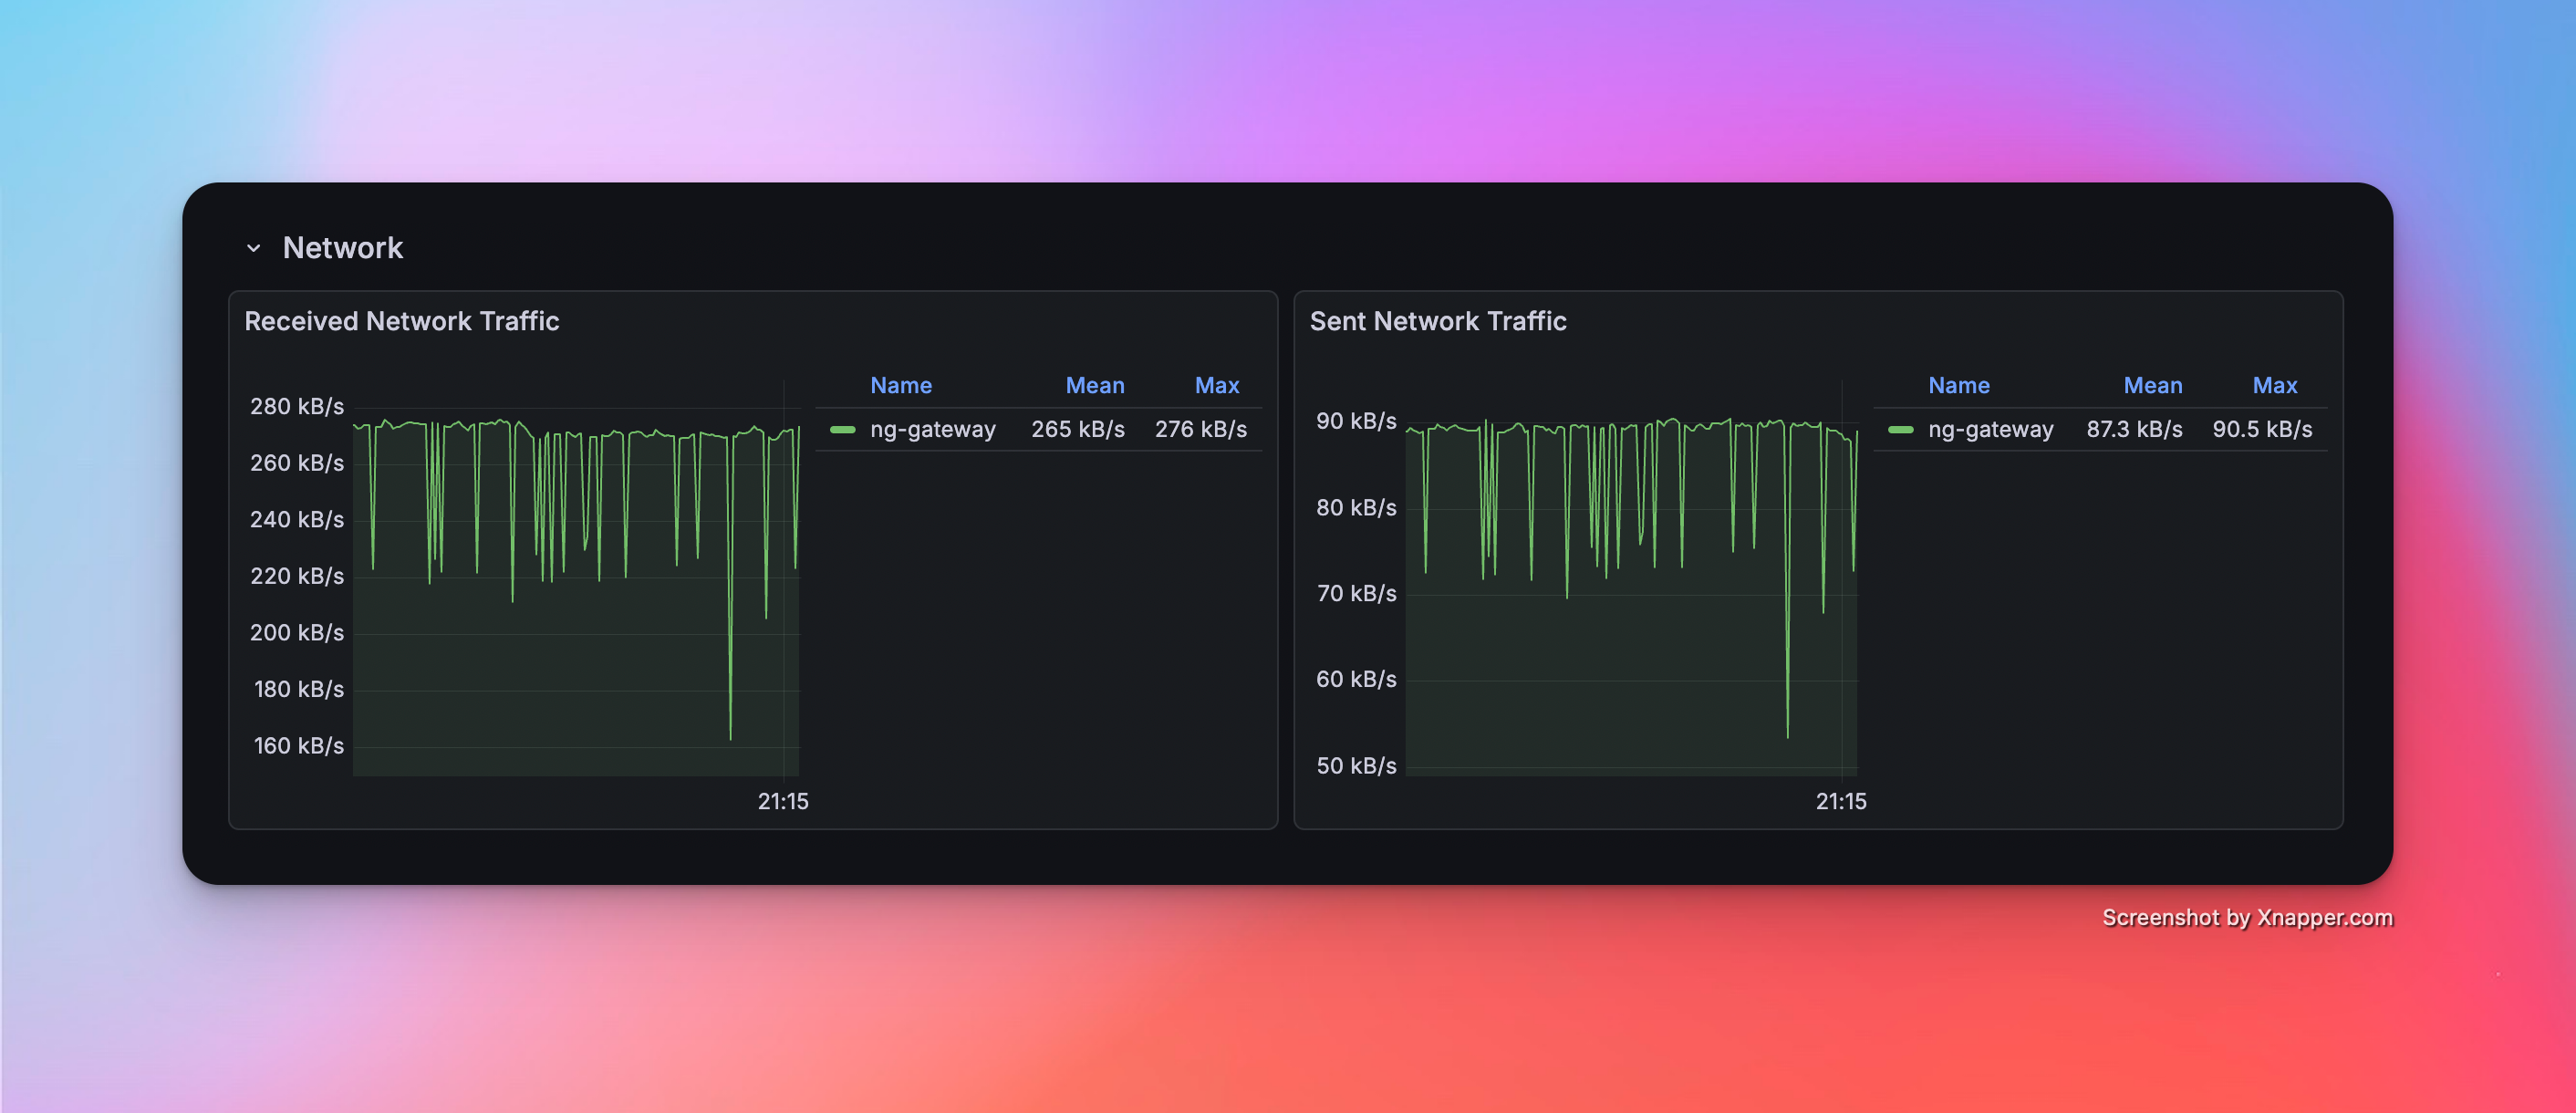
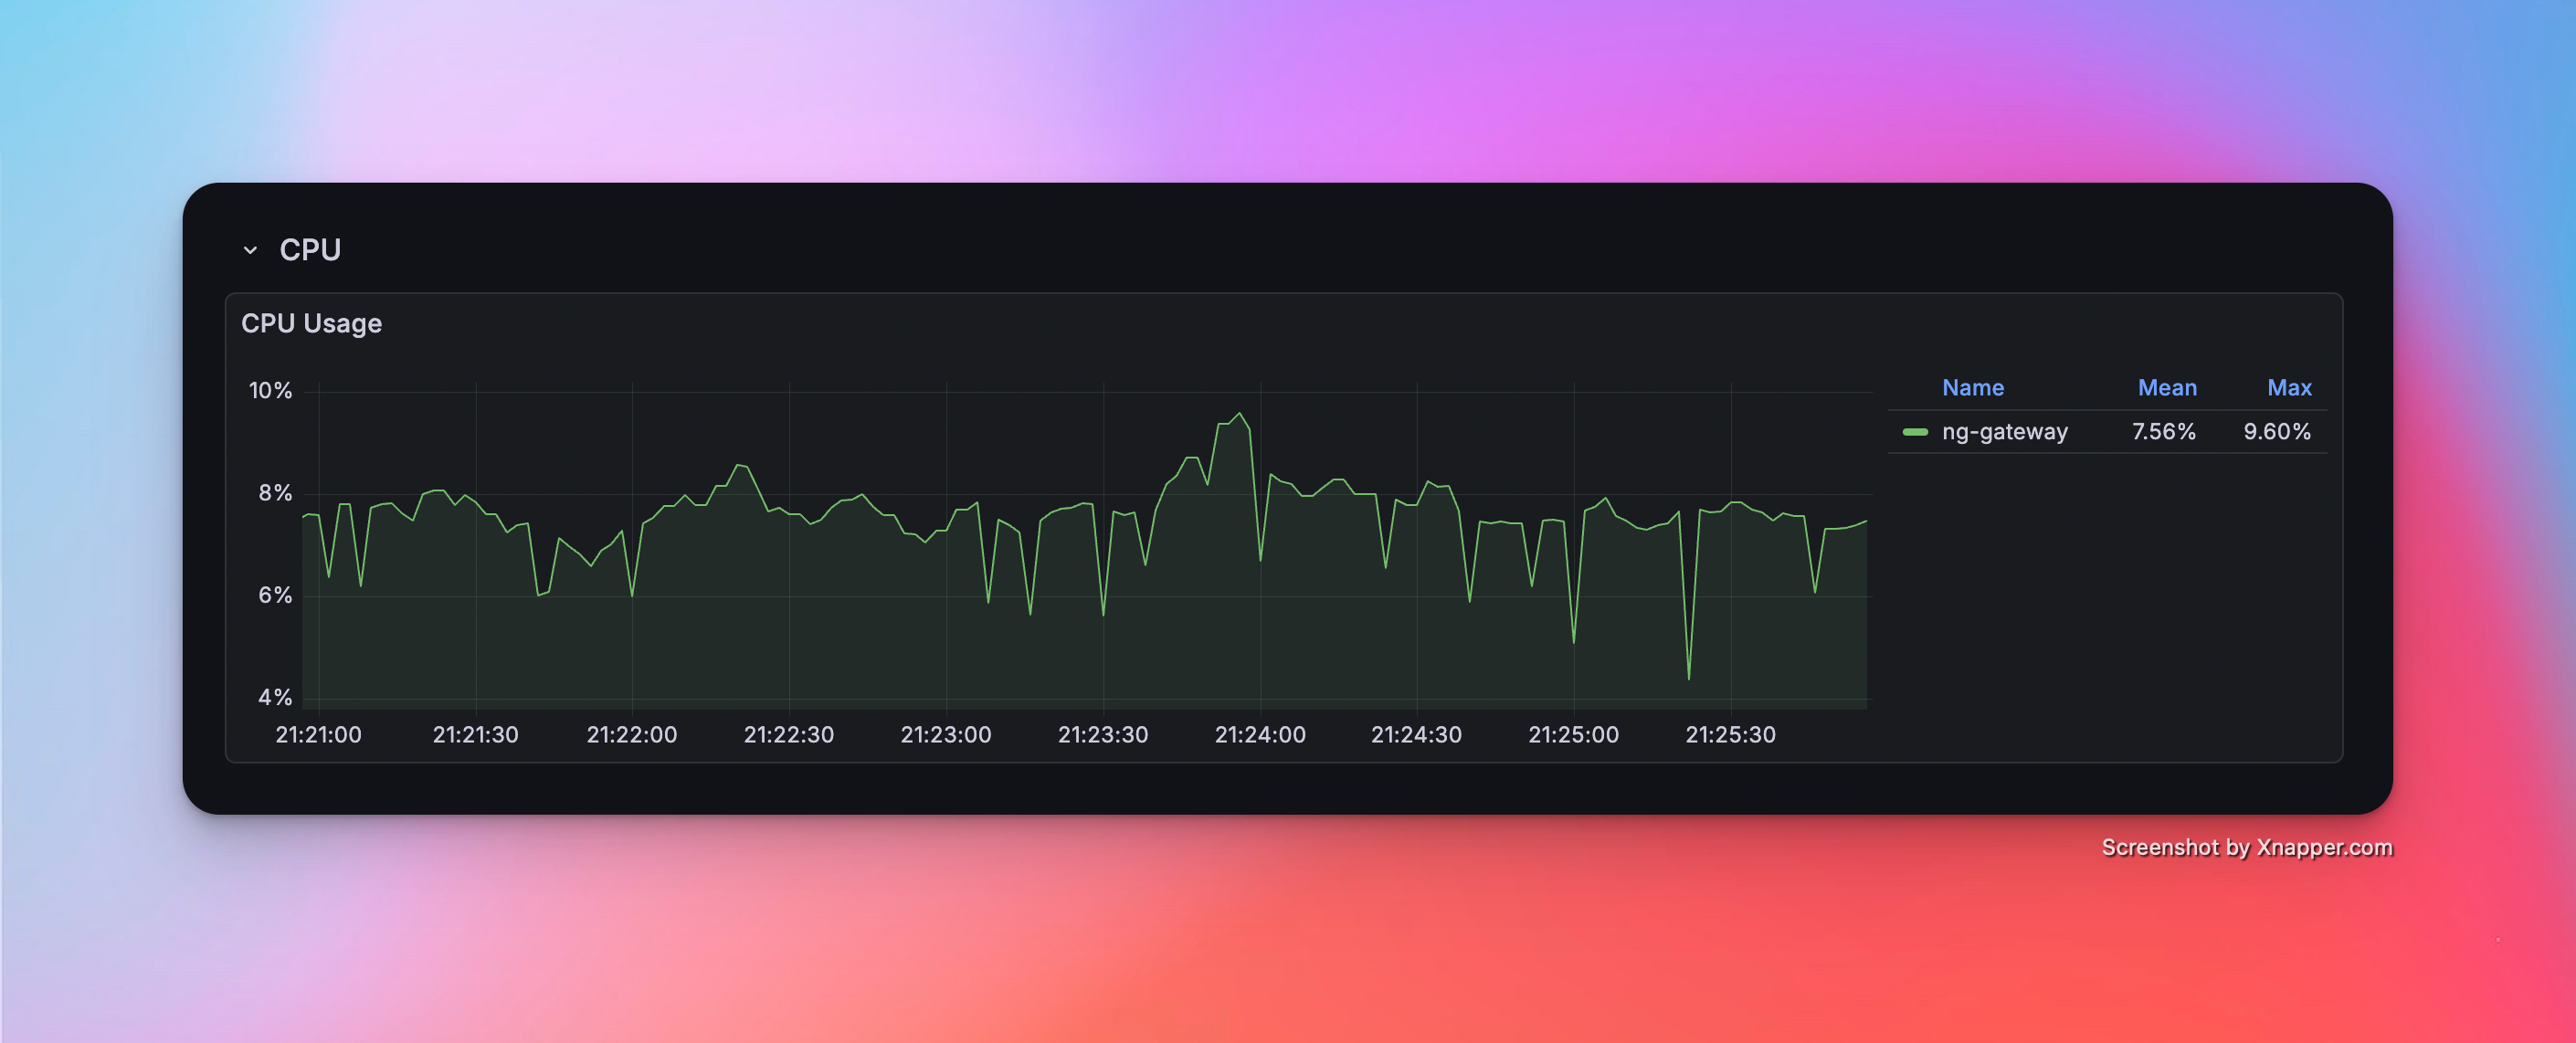
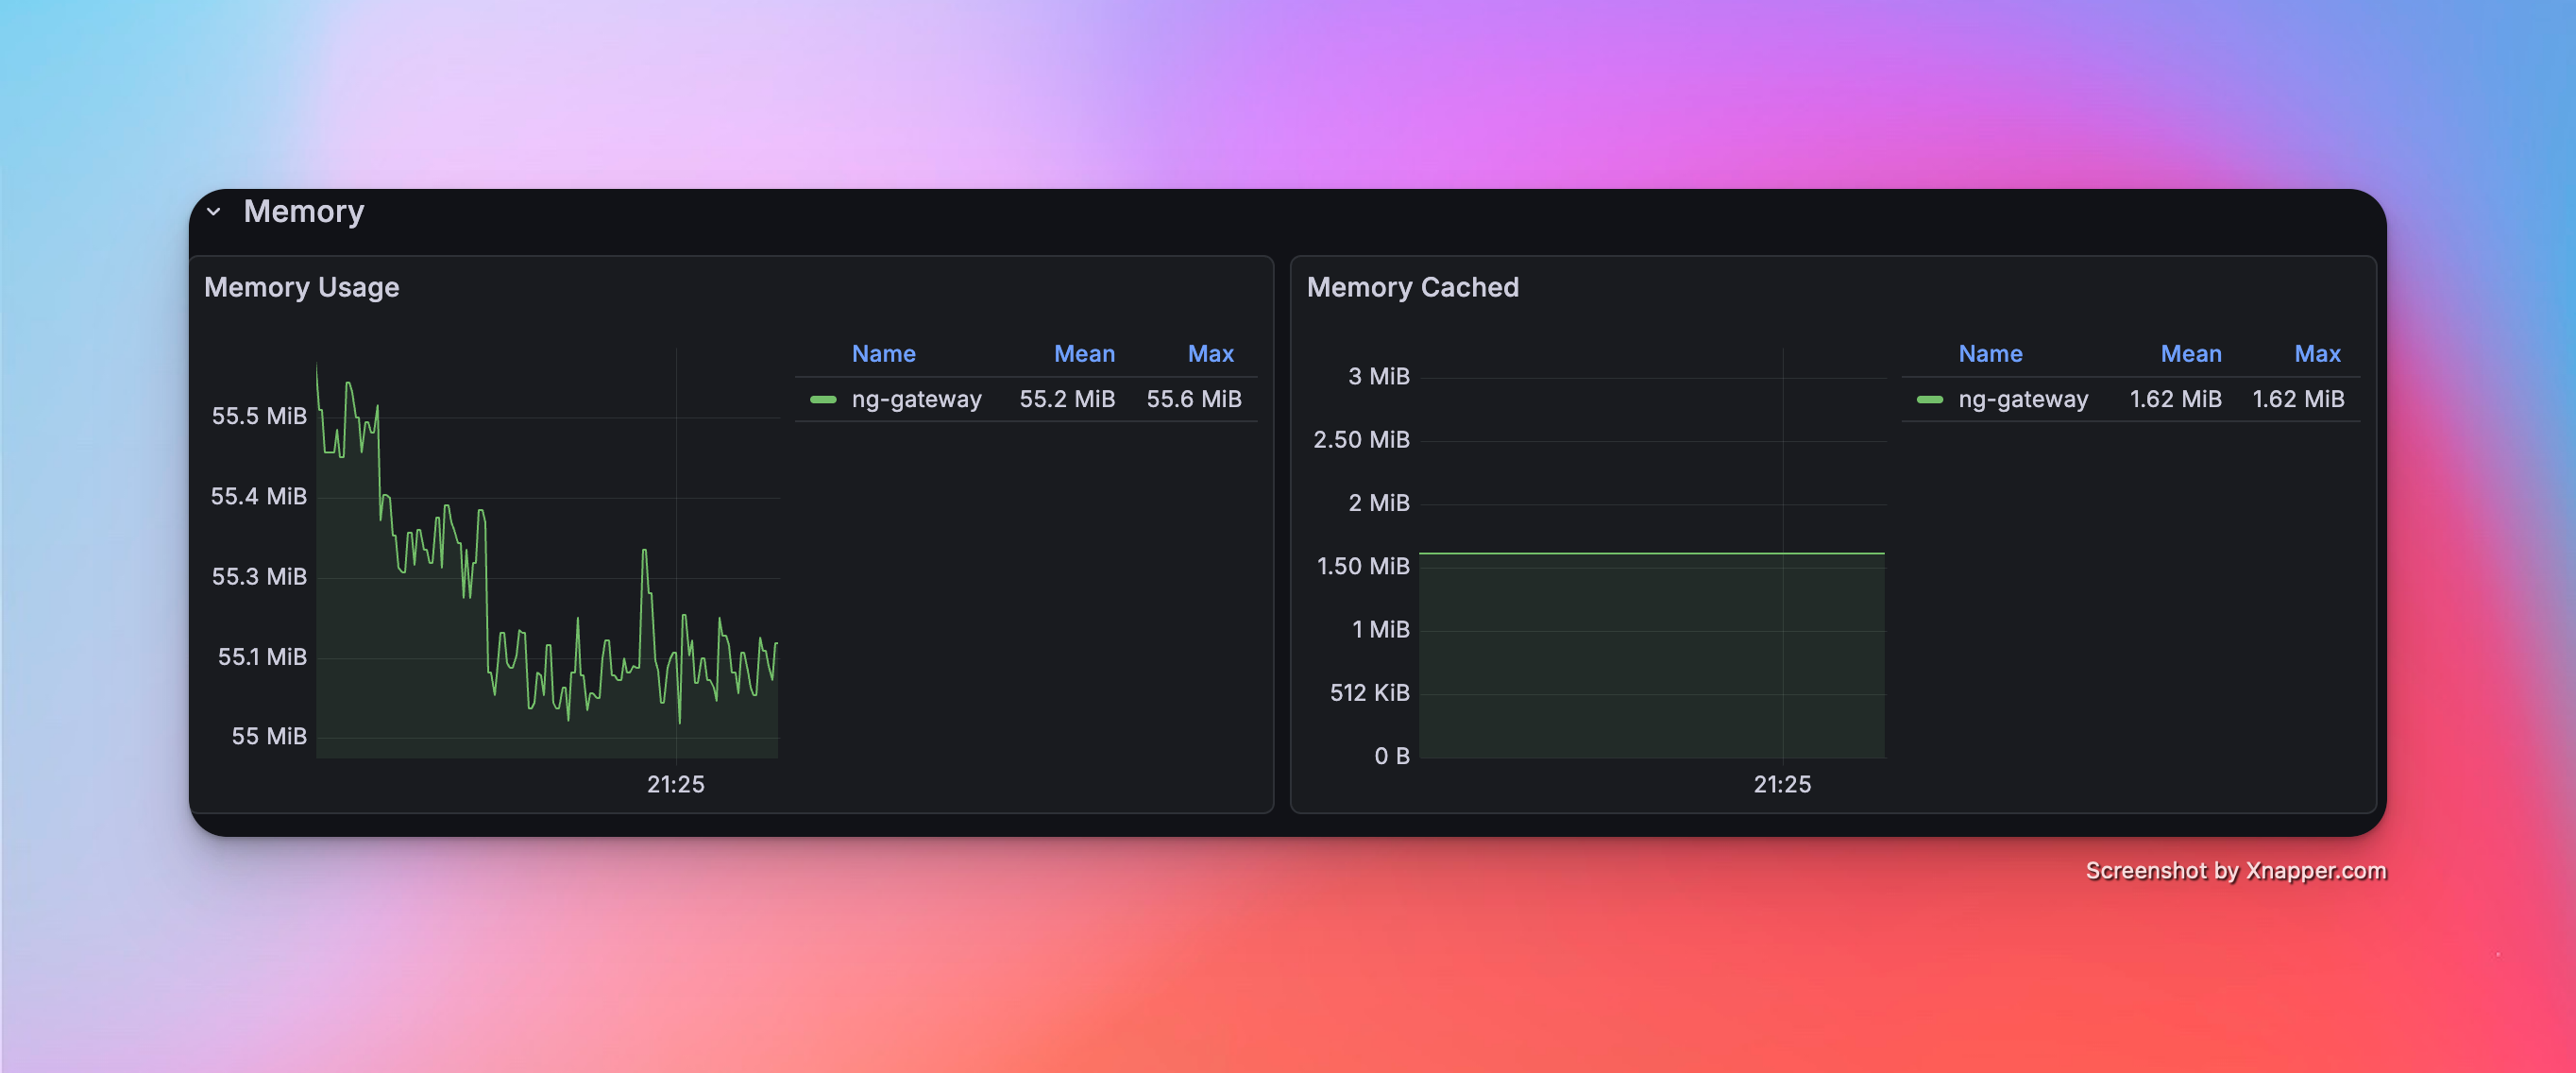
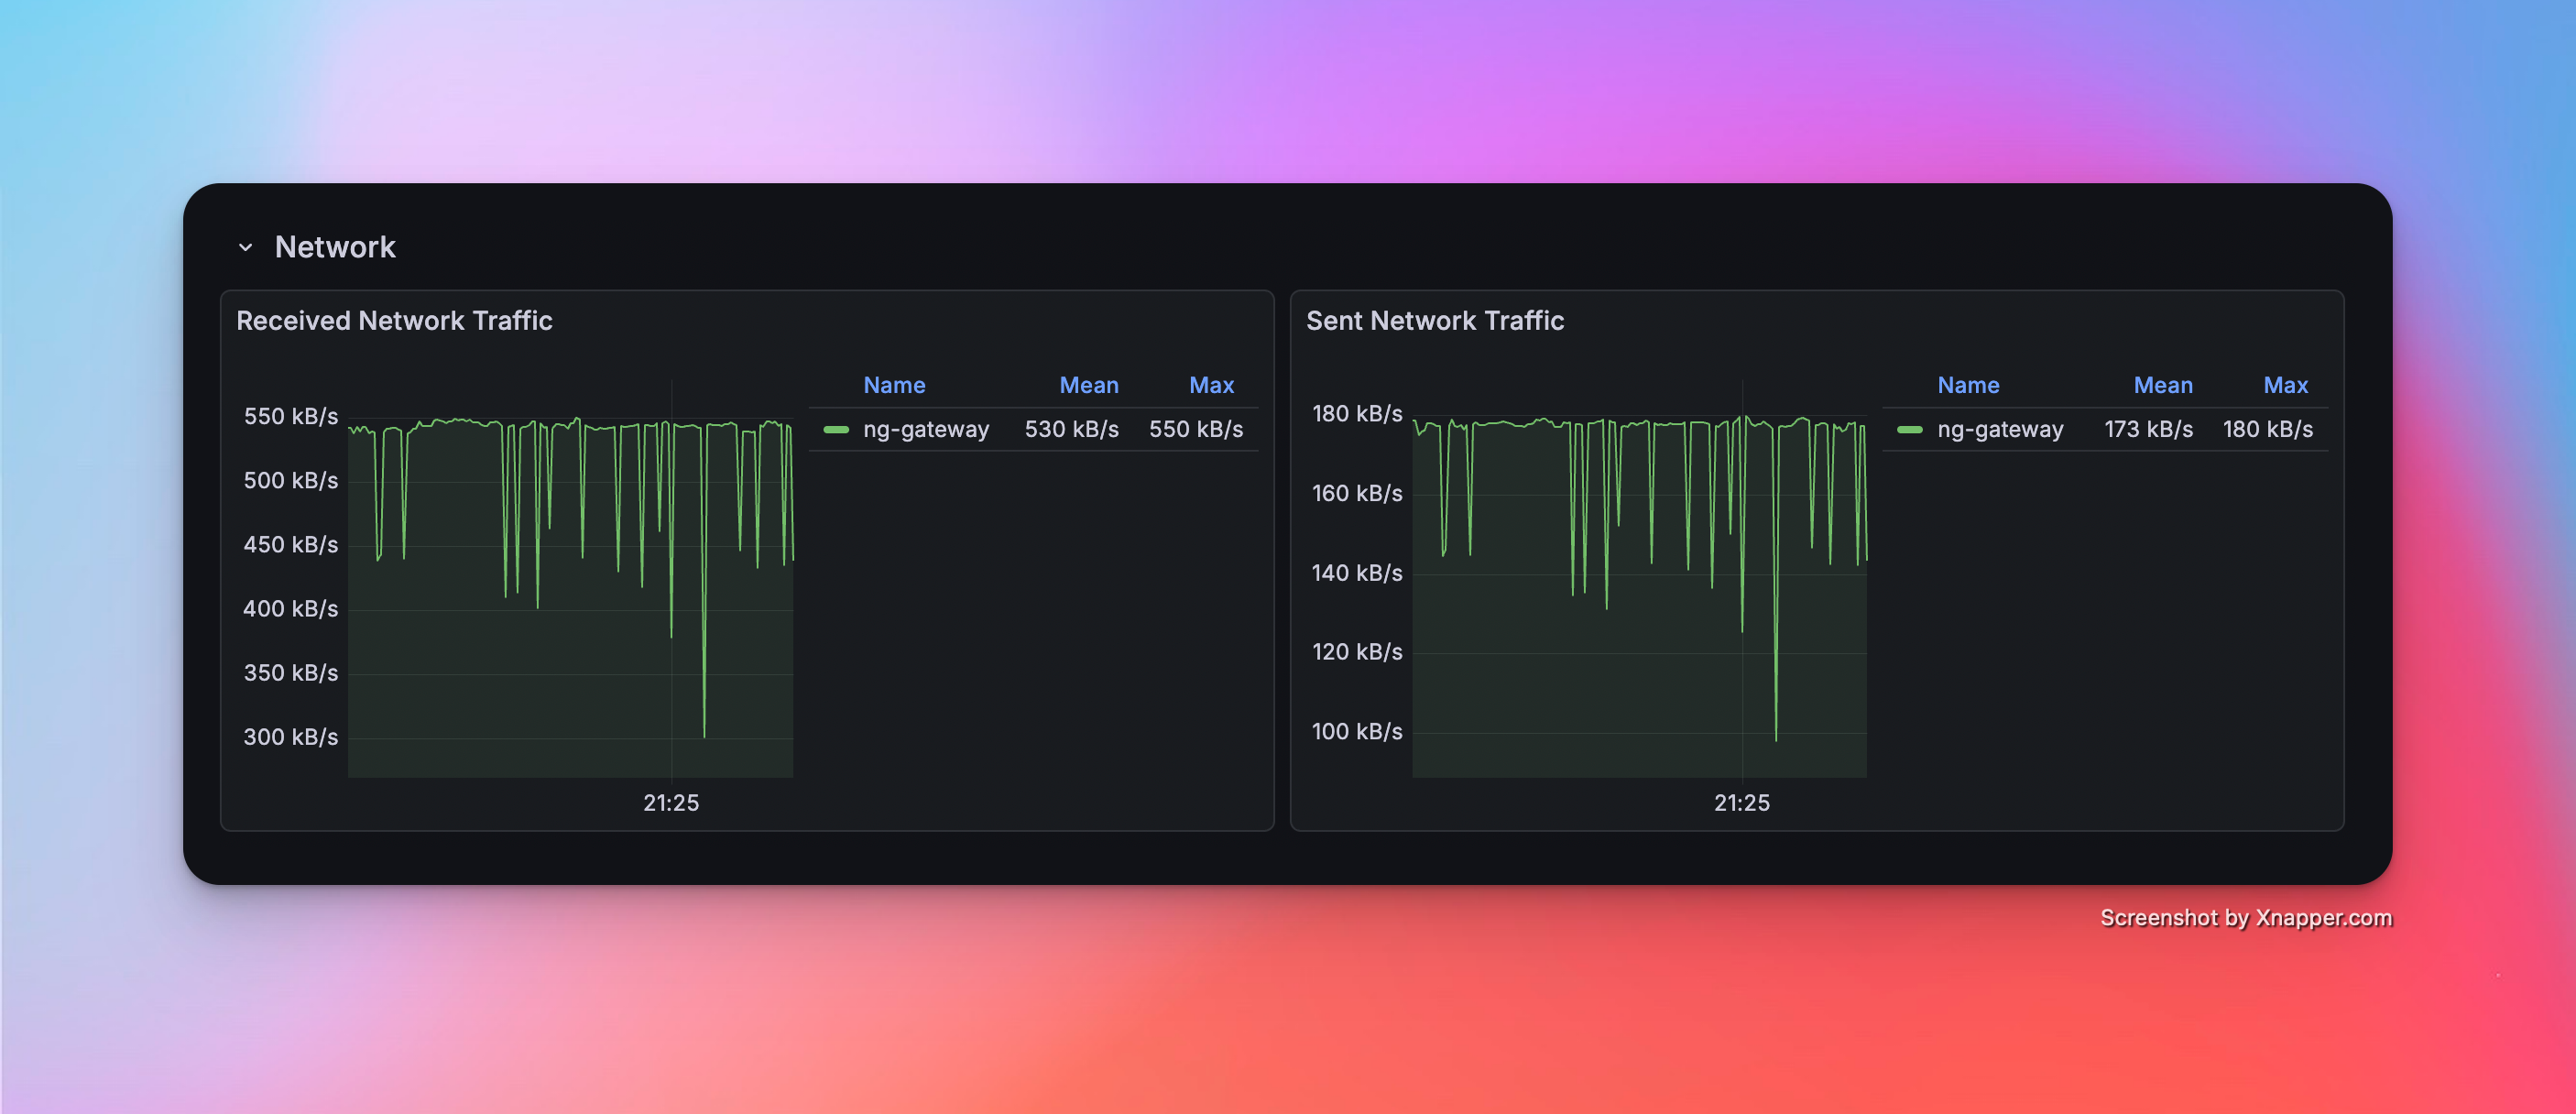
场景 6:高频采集(大规模)
- 配置:10 通道 · 1 设备 · 1,000 点位/设备 · 100 ms 周期(总计 10,000 点位)
性能指标
| 内存 | CPU | 网络带宽消耗 |
|---|---|---|
| 55.2 Mib | 7.56% | rx: 530.0 kB/s tx: 173.0 kB/s |
资源监控截图
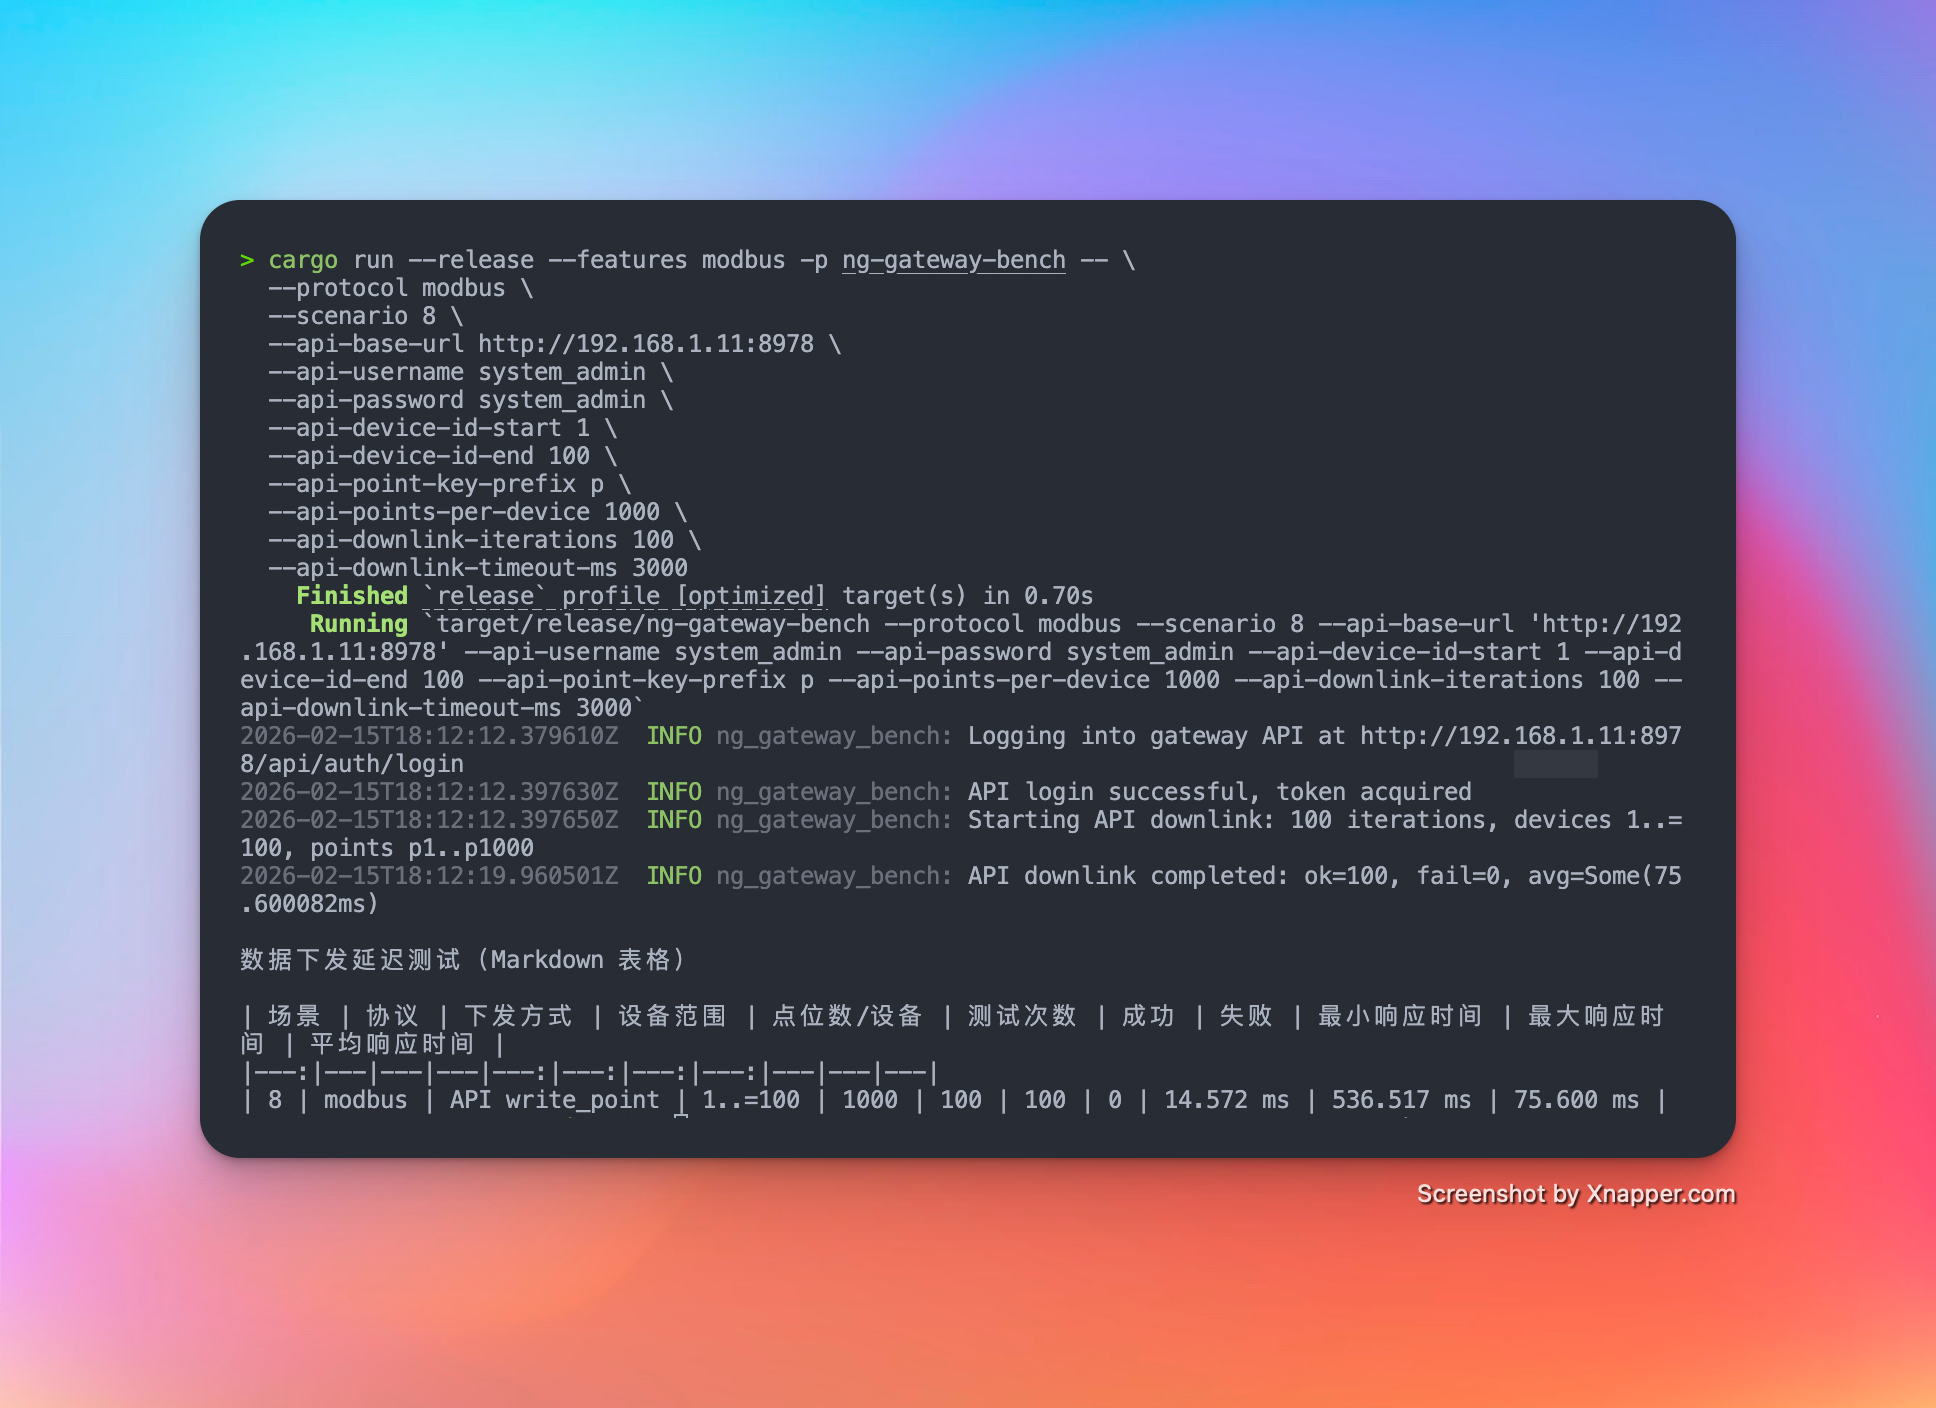
场景 7:混合负载(采集 + 下发)
- 配置:10 通道 · 10 设备 · 1,000 点位/设备 · 1000 ms 周期(总计 100,000 点位)+ 随机指令下发
性能指标(采集)
| 内存 | CPU | 网络带宽消耗 |
|---|---|---|
| 153 MiB | 7.03% | rx: 542.0 kB/s tx: 144.0 kB/s |
性能指标(下发)
| 成功/失败 | 最小延迟 | 最大延迟 | 平均延迟 |
|---|---|---|---|
| 100 / 0 | 14.572 ms | 536.517 ms | 75.600 ms |
资源监控截图